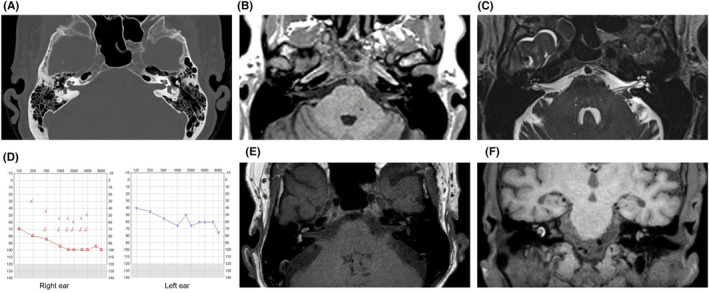
FIGURE 1.

(A) CT scan of the ear without any inflammatory or neoplastic changes in the middle ear and normal otic capsule. (B) Pre‐contrast axial T1‐weighted MRI imaging showing a slight hyperintensity in the area of the cochlea/vestibular apparatus on the right side and in the cochlea on the left side due to the presence of methemoglobin from blood. (C) T2‐weighted MRI imaging showing loss of perilymph signal mainly in the scala tympani and in the vestibule in the right cochlea. (D) Tone audiogram on day 7. (E, F) Follow up pre‐contrast axial T1‐weighted MRI and fat saturated coronal images showing even more distinct signs of bilateral inner ear hemorrhage.
