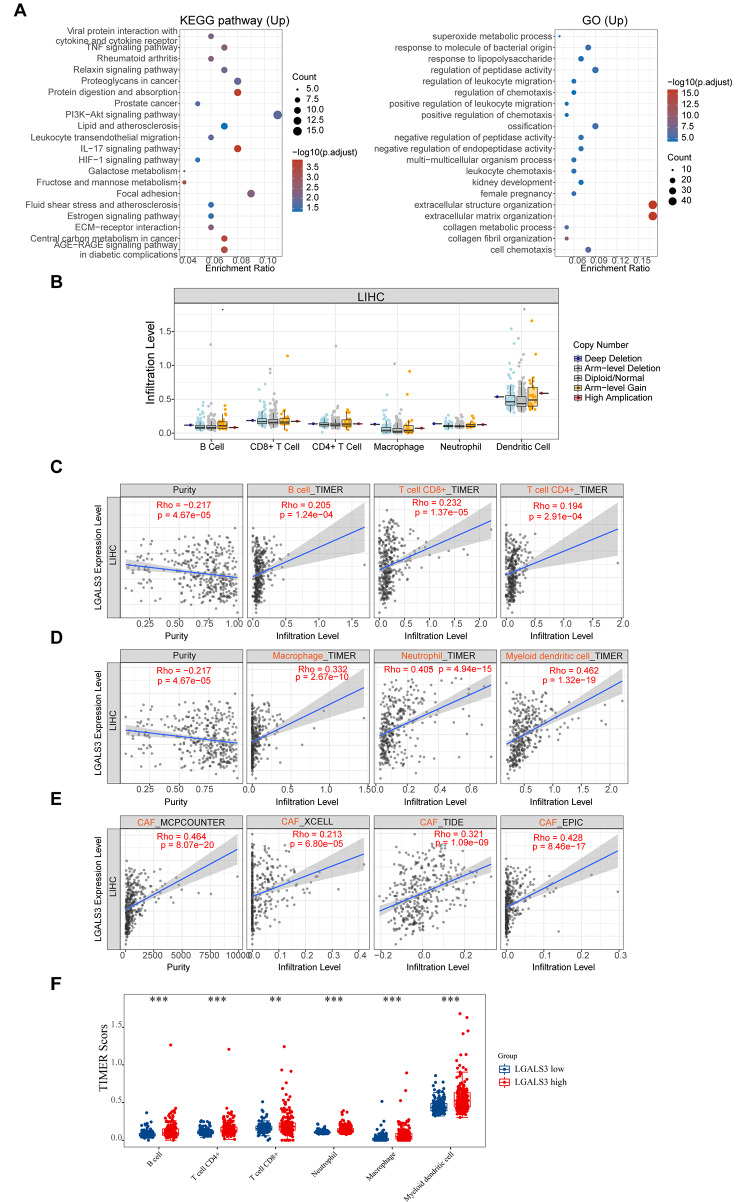
Fig. 5.
The relationship of LGALS3 expression with immune cell infiltration in HCC. (A) The enriched KEGG signaling pathways were selected to demonstrate the biological actions of major potential mRNA. The abscissa indicates gene ratio and the enriched pathways were presented the ordinate. GO analysis of potential targets of mRNAs. Colors represent the significance of differential enrichment, the size of the circles represents the number of genes, the larger the circle, the greater the number of genes. In the enrichment result, p < 0.05 is considered to be a meaningful pathway. (B) Association of copy number alteration of LGALS3 with the infiltration level of various immune cells in HCC assessed by TIMER. (C–E) Correlation analysis between LGALS3 expression level and B cell, CD4+ T cell, CD8+ T cell, neutrophil, macrophage, dendritic cell, or CAFs infiltration level in HCC assessed by TIMER2. (F) The expression distribution of immune score in HCC patients with high and low LGALS3 expression. The abscissa represents immune cell types, and the ordinate represents the expression distribution of immune score in low LGALS3 expression groups or high LGALS3 expression groups. **p value < 0.01; ***p value < 0.001

