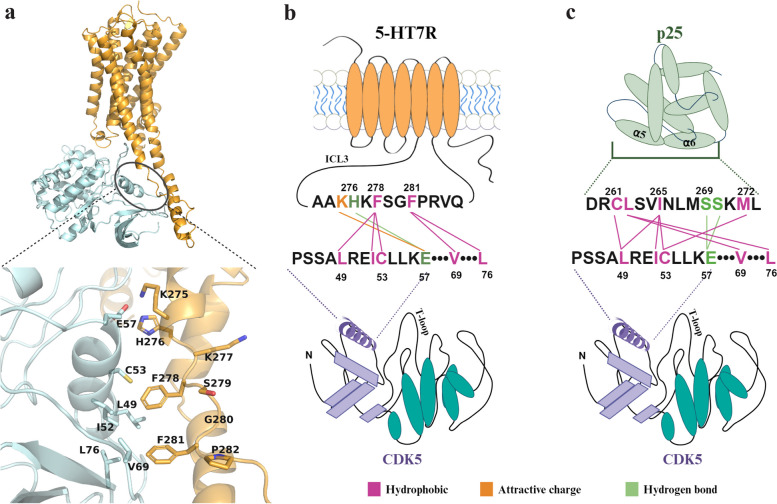
Fig. 4.
ColabFold 5-HT7R/CDK5 interaction interface prediction and comparison to CDK5/p25 complex. A General view of energy minimized ColabFold model for m5-HT7R/CDK5 protein complex. Enlarged view shows of contacts between ICL3 and CDK5 αC-helix. 5-HT7R is shown in orange and CDK5 in light cyan color. B Scheme depicts amino acid residues within m5-HT7R ICL3 and CDK5 αC-helix proposed to be involved in m5-HT7R/CDK5 interaction interface. C. Scheme depicts amino acid residues within α5 and α6 p25 domains and CDK5 αC-helix involved in formation of interaction interface (based on X-ray crystal structure 1H4L [53]. The α-helixes are shown as ovals and β-sheets as parallelograms. The CDK5 PSSALRE region is highlighted as a violet helix. Images in (B) and (C) were created using BioRender

