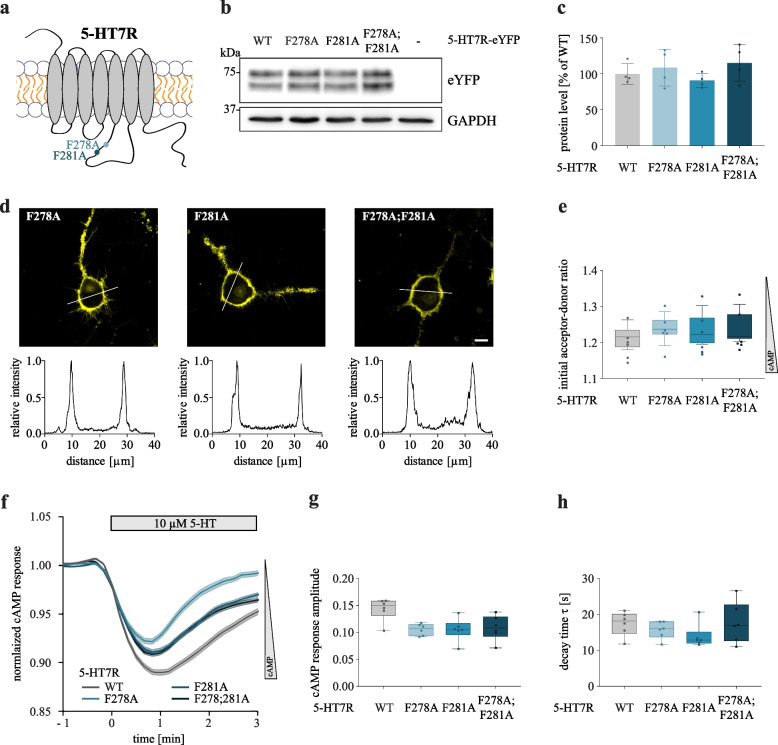
Fig. 5.
Characterization of 5-HT7R phenylalanine mutants. A. Scheme of 5-HT7R phenylalanine mutants. B, C Expression of HA-tagged 5-HT7R WT or indicated mutants in N1E-115 cells. Representative Western blot (B) and quantification (C) are shown. Data are presented as mean ± SD (N = 4, one-way ANOVA, Dunnett’s multiple comparisons. D Representative confocal images showing expression of eYFP-tagged 5-HT7R mutants. Corresponding intensity profiles are shown below. Scale bar: 10 μm. See also Additional file 12. E N1E-115 cells were transfected with cAMP FRET-based biosensor CEPAC and indicated eYFP-tagged 5-HT7R constructs. Basal cAMP levels are shown. Signals are normalized to cells transfected with 5-HT7R WT (N = 6, one-way ANOVA, Dunnett’s multiple comparisons, no statistical significance to WT). F Representative traces showing cAMP response at the single cell level after stimulation with 10 µM of 5-HT. G, H Graphs show response amplitude (G) and activation time constant (H) of cAMP relative to pretreatment (N = 6, one-way ANOVA, Dunnett’s multiple comparisons, no statistical significance to WT)

