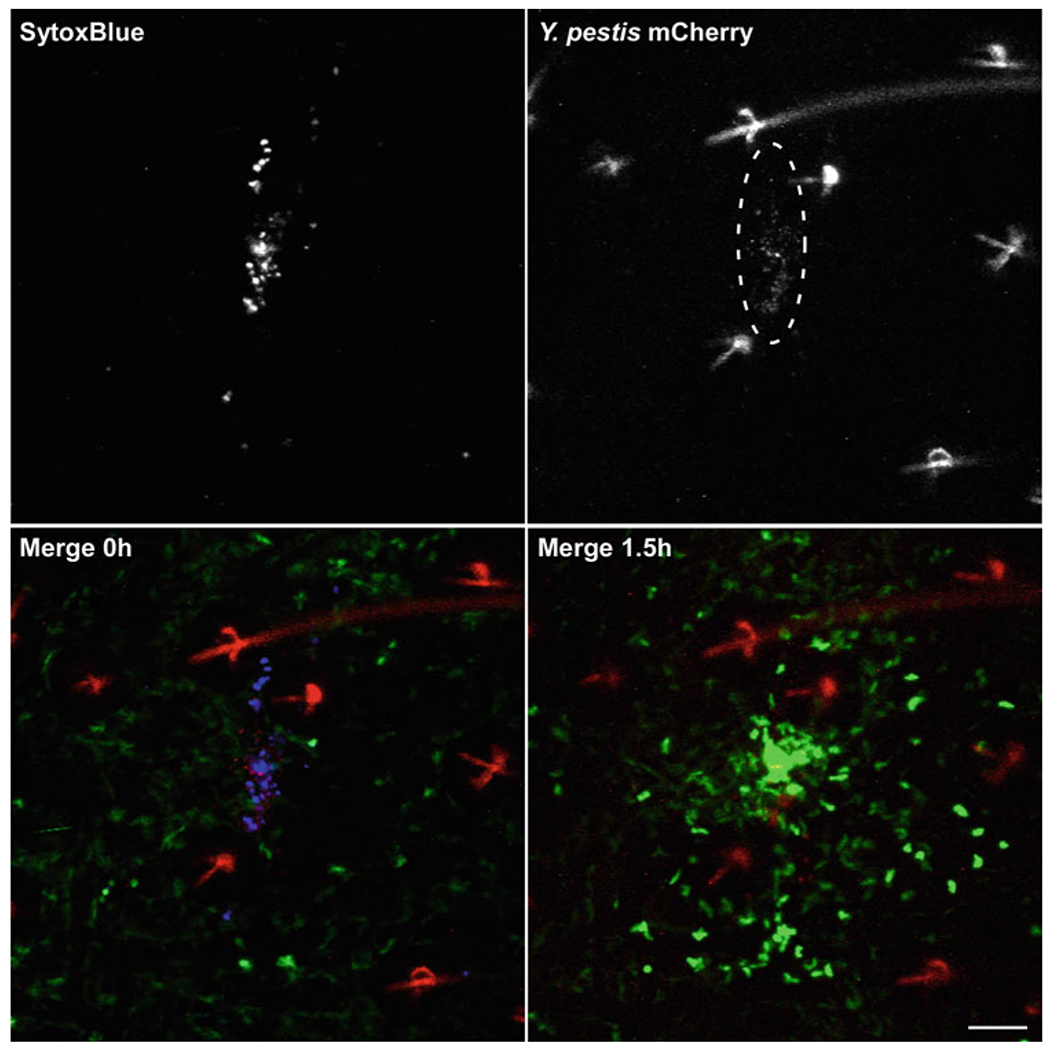
Fig. 3.

Imaging neutrophils at a flea bite site containing flea-transmitted Y. pestis. Confocal images of the ear of a LysozymeM-eGFP mouse injected i.p. with Sytox Blue prior to being fed upon by fleas infected (blocked) with Y. pestis expressing mCherry. Imaris software was used to make maximum intensity projections of a Z-stack for the Sytox Blue and mCherry channels (upper panels). Merged images of the blue, red and green (GFP) channels show the 0 h and 1.5 h time points (lower panels). This flea bite site was identified by the Sytox Blue staining. The dashed ellipse in the red channel indicates an area where Y. pestis were deposited in the skin (note that hair and hair follicles autofluoresce in the red channel). Only a few GFP-bright neutrophils can be seen in the green channel at 0 h; large numbers of neutrophils were recruited to this bite site by the 1.5 h time point. Scale bar equals 70 μm
