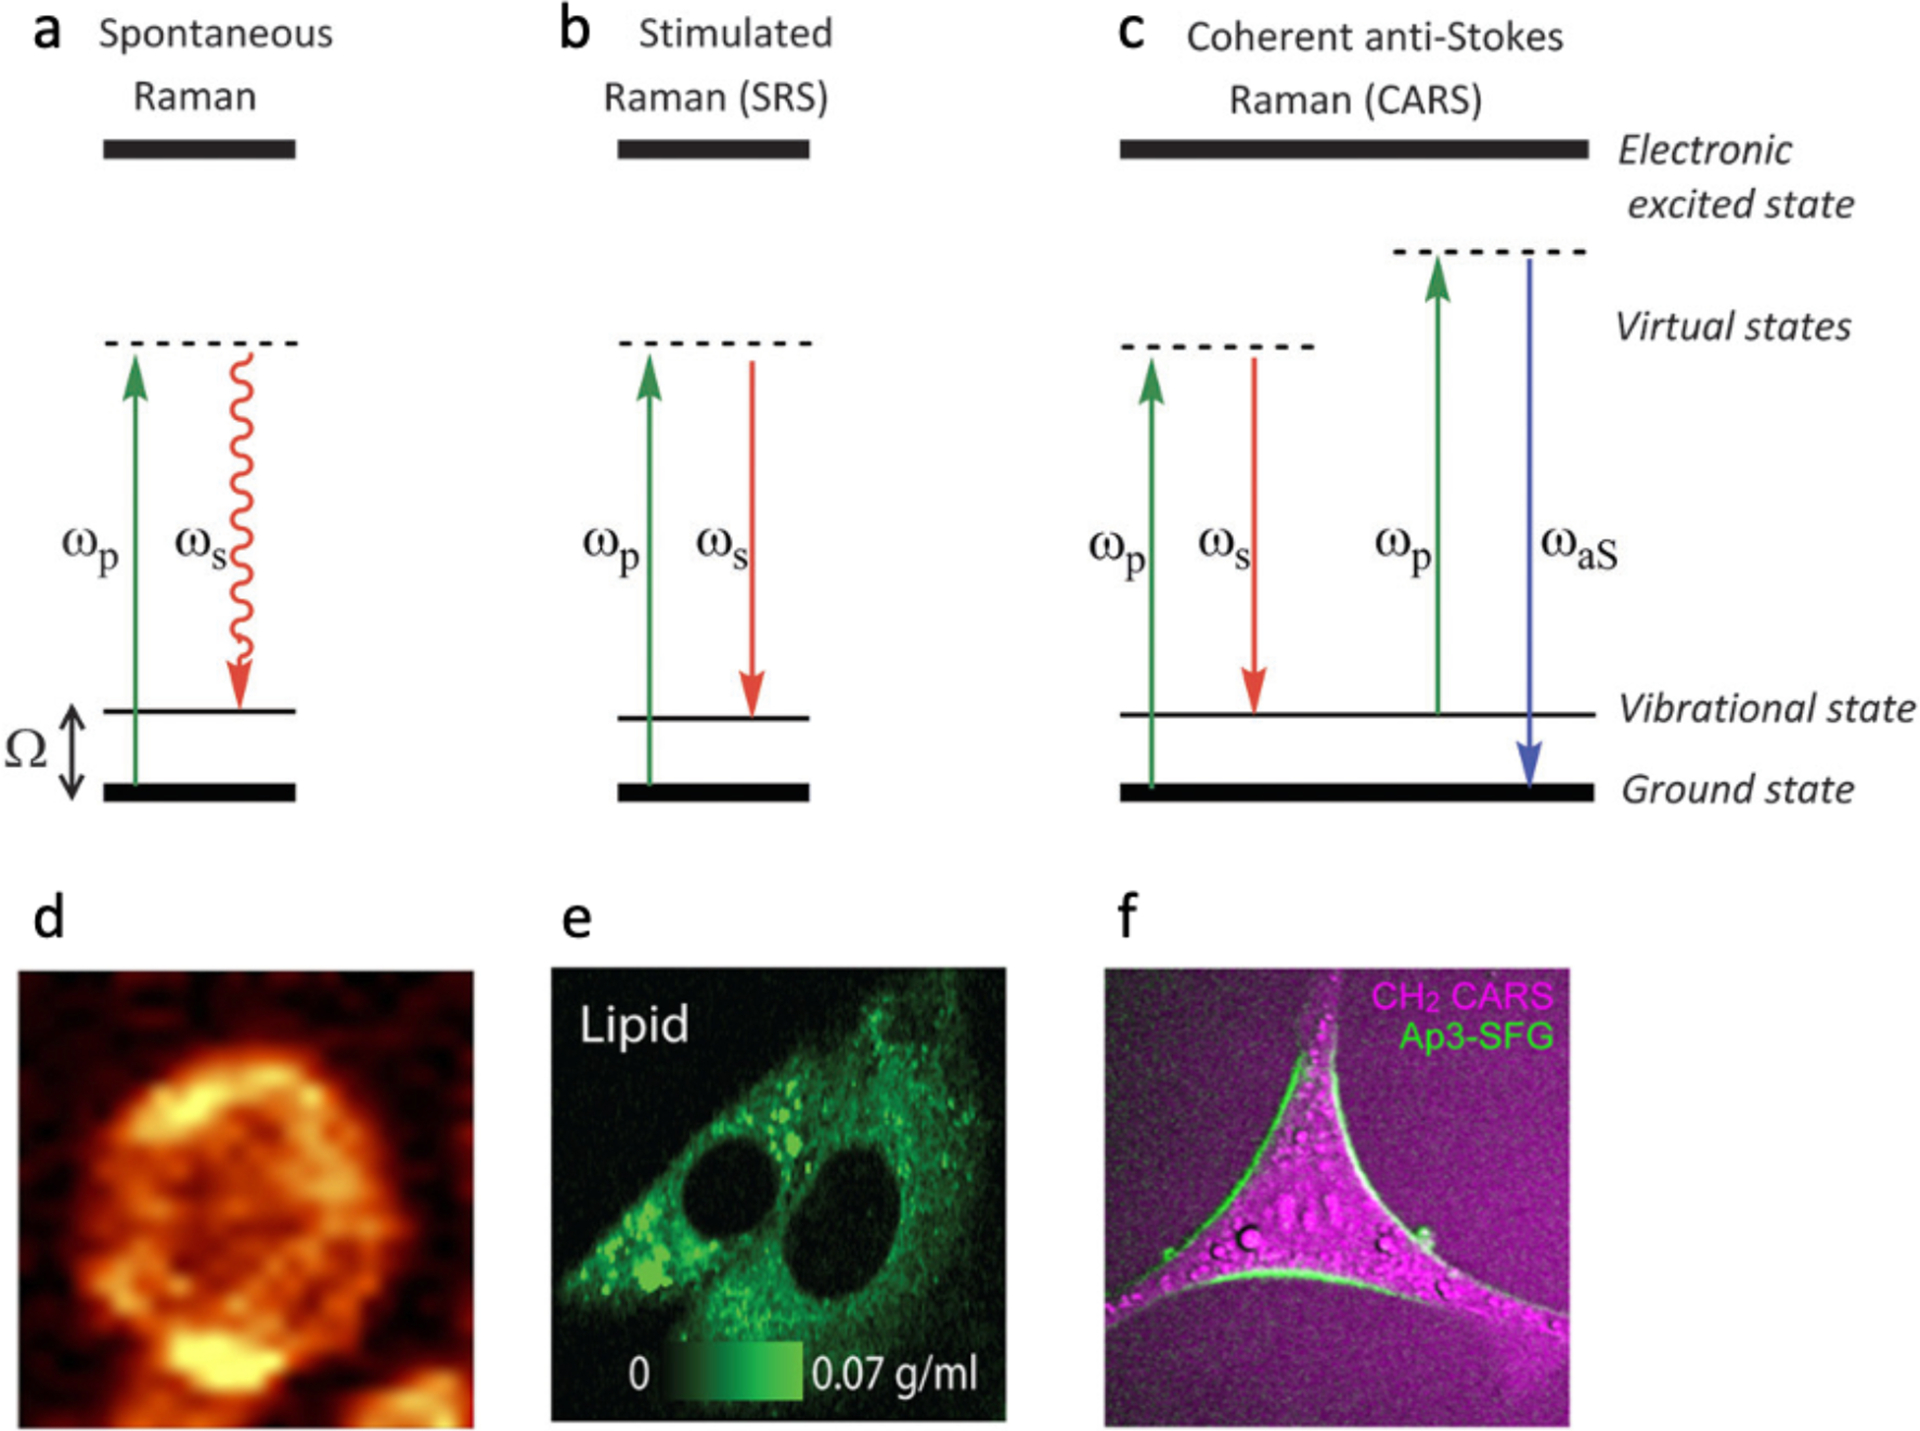
Figure 2.

Raman imaging of single cells. (a-c) Schematics demonstrating the energy level diagrams in Raman imaging. (a) Spontaneous Raman scattering. The straight line (green) indicates the pump beam at ωP, and the curved line (red) denotes the scattered light at a longer wavelength ωS. (b) Stimulated Raman scattering (SRS). Two lasers, a pump (ωP) and a Stokes beam (ωS) impinge upon a sample with stimulated emission occurring when △ω (Dω = ωP - ωS) equals to a molecular vibration frequency. (c) Coherent anti-stokes Raman scattering (CARS). In CARS, a pump (ωP) and a Stokes beam (ωS) illuminate the sample and when ωP - ωS matches the molecular vibration frequency an anti-Stokes signal at 2ωP - ωS = ωaS is generated. (d) Distribution of lipids (1420–1460 cm−1) in a pulmonary cell obtained by spontaneous Raman imaging. (e) An SRS image showing the concentration of cytoplasmic membrane lipids in live melanoma cells. (f) CARS image of a neuronal cell. The purple color shows CH2 bonds while the green color is the plasma membrane dye, Ap3-SFG. Panel a-c was reprinted with permission from Tipping WJ, Lee M, Serrels A, Brunton VG, Hulme AN. Chem Soc Rev. 2016;45(8):2075–89. Panel d was reprinted with permission from Tott S, Grosicki M, Glowacz J, Mohaissen T, Wojnar-Lason K, Chlopicki S, et al. Biochimica et Biophysica Acta 2021;1867(9):166180. Panel e was reprinted with permission (CC BY-NC-ND) from Oh S, Lee C, Yang W, Li A, Mukherjee A, Basan M, et al. Proc Natl Acad Sci USA. 2022;119(17):e2117938119. Panel f was reprinted with permission from Mizuguchi T, Momotake A, Hishida M, Yasui M, Yamamoto Y, Saiki T, et al. Anal Chem. 2020;92(8):5656–60. Copyright 2020 American Chemical Society.
