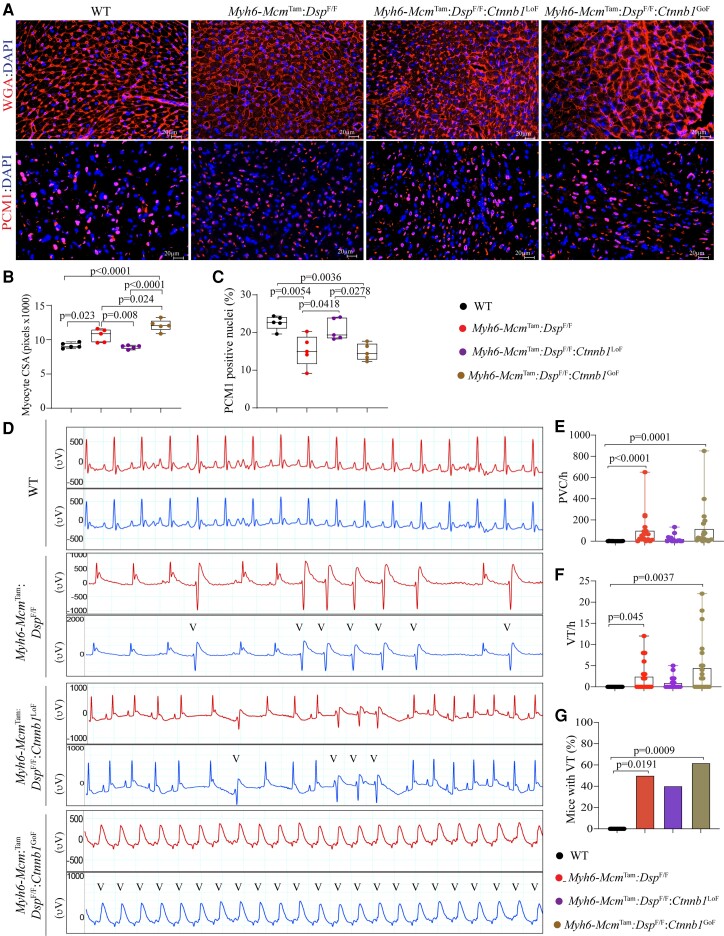
Figure 4.
Effects of genetic inactivation and activation of β-catenin on cardiac myocyte size and arrhythmias. (A) WGA and PCM1 co-stained thin myocardial sections were used to calculate myocyte CSA, which is depicted in (B). Quantitative data depicting myocyte CSA calculated from the WGA-stained sections and corrected for the number of myocytes. (C) The number of myocardial cells expressing PCM1, a marker mainly of cardiac myocytes in the heart. (D) Illustrates selected two-lead electrocardiograms showing the presence of ventricular ectopic beats in the experimental groups and their absence in the WT mice. (E–G) Quantitative data depict an increased number of PVCs, ventricular tachycardia (VT), and the number of mice exhibiting VT in the experimental but not the control groups. The mean values among the groups were compared by ANOVA followed by Bonferroni correction for multiple comparisons. Only significant P values (Bonferroni corrected) are depicted in the panels throughout all figures. Sample size: Each dot in the panels represents one independent sample throughout the figures. Whenever a membrane is probed for multiple test proteins, the same blot for the loading control is included in the figures.

