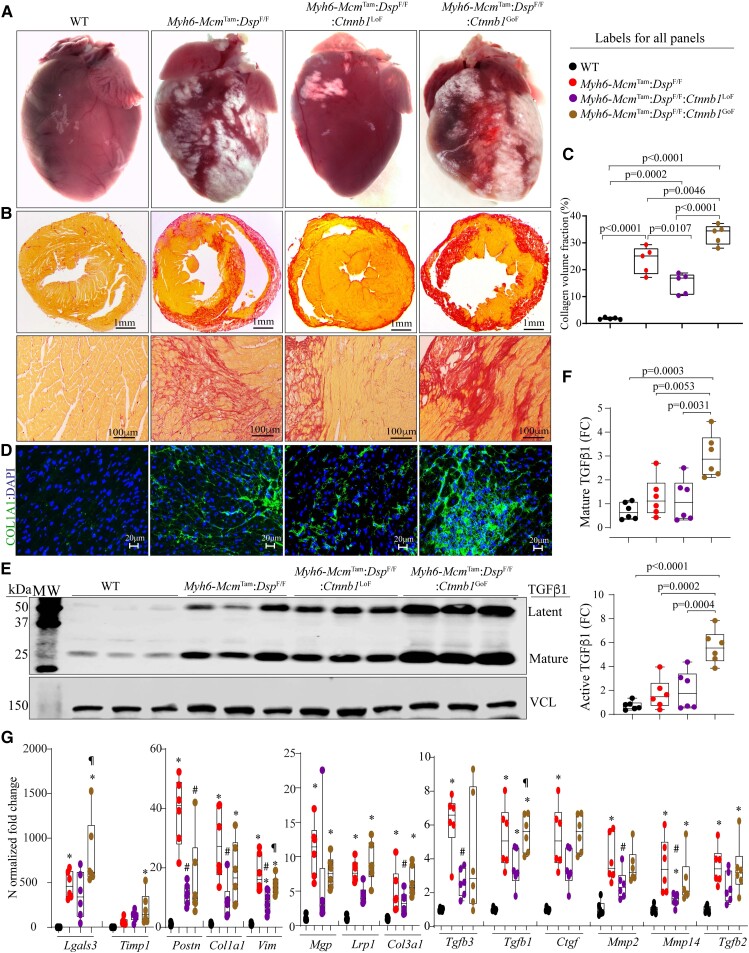
Figure 5.
Effects of genetic inactivation and activation of β-catenin on myocardial fibrosis. (A) Exhibits gross heart morphology, showing extensive epicardial fibrosis (white areas) in the experimental groups. (B) Shows picrosirius red-stained thin myocardial cross-sections (upper panels) and high magnification thin myocardial sections (lower panels), used to calculate CVF. (C) Graph depicts CVF in the study groups. (D) Immunofluorescence panels showing myocardial sections stained with an antibody against COL1A1. (E and F) Immunoblots showing expression of TGFβ1, latent (upper panel), and active (lower panel) in the study groups along with the quantitative data for each isoform. (G) Transcript levels of selected genes involved in fibrosis as quantified by RT–PCR. Symbols as in Figure 4. The mean values among the groups were compared by ANOVA followed by Bonferroni correction for multiple comparisons. Only significant P values (Bonferroni corrected) are depicted in the panels throughout all figures. Sample size: Each dot in the panels represents one independent sample throughout the figures. Whenever a membrane is probed for multiple test proteins, the same blot for the loading control is included in the figures. The same color symbols in all quantitative panels are used for consistency and only one set of symbols is listed in each panel to avoid redundancy. * denotes P < 0.05 compared to WT, # P < 0.05 compared to Myh6-McmTam:DspF/F and ¶ P < 0.05 compared to Myh6-McmTam:DspF/F:Ctnnb1LoF.

