Figure 2.
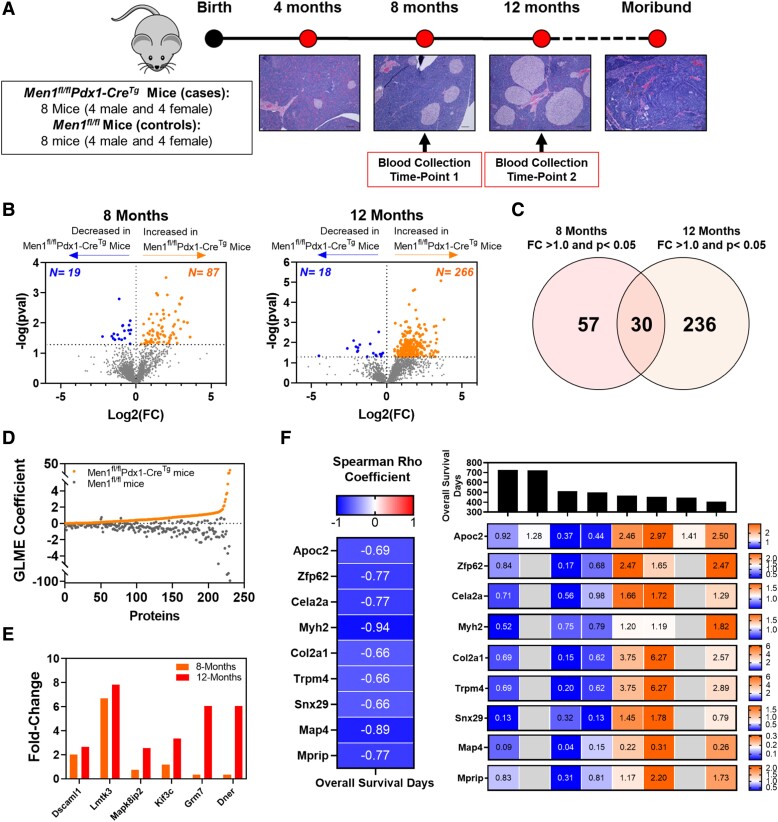
Proteomic signatures associated with disease progression in a MEN1-PanNET mouse model. (A) Schematic of study design. Figure was adapted from a prior publication (18). (B) Volcano plots showing differential circulating proteins in Men1fl/flPdx1-CreTg compared to Men1fl/fl control mice at age 8 (left) and 12 months (right). Orange nodes represent those proteins that were statistically significantly (raw P < 0.05) elevated in Men1fl/fl Pdx1-CreTg mice; blue nodes represented proteins that are statistically significantly decreased. Horizonal dashed line shows raw P-value threshold of 0.05. P-values were determined by 2-sided Student T-test. (C) Venn diagram showing overlap between proteins that were statistically significantly elevated in Men1fl/flPdx1-CreTg mice at age 8 and 12 months. (D) Scatter plot showing coefficients from the generalized linear mixed effect models for proteins that were positively associated with disease progression in Men1fl/flPdx1-CreTg mice. (E) Bar plot showing fold change of proteins elevated in Men1fl/flPdx1-CreTg mice and that are associated with neuronal development and function. (F) Proteins that were statistically significantly [Log-rank (Mantel-Cox) test sided P < .05] with poor overall survival in Men1fl/flPdx1-CreTg mice at the 8-month sampling timepoint. For survival analyses, proteins were stratified into high or low based on median level. The left heatmap shows Spearman correlation coefficients for respective proteins and overall survival days. The right heatmap displays normalized circulating protein levels and overall survival times among individual Men1fl/flPdx1-CreTg mice. Grey boxes indicate that the protein was not quantified in the respective sample. Abbreviations: PanNET, pancreatic neuroendocrine tumor.

