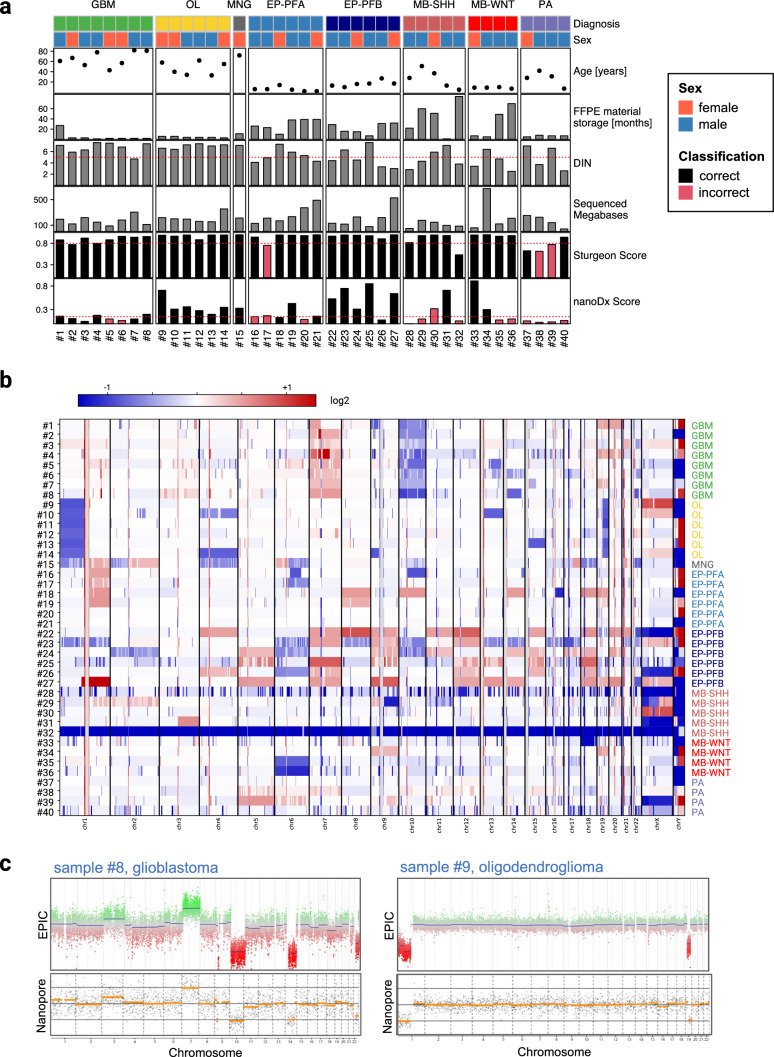
Fig. 1.
Sample overview and results of FFPE DNA nanopore sequencing analysis. a Sample overview of cohort with clinical characteristics as well as analysis results. b CNV heatmap of analyzed samples, with losses in blue and gains in red. Samples show expected chromosomal alterations, especially glioblastomas (GBM) with the characteristic +7/−10 signature and co-deletion of Chr 1p and 19q in all oligodendrogliomas (OL). Samples #28 and #32 did not produce enough data for sufficient CNV representation. c Comparison of EPIC CNV plots (top) and Nanopore CNV plots (bottom) for samples #8 and #9, showing high concordance between the two methods

