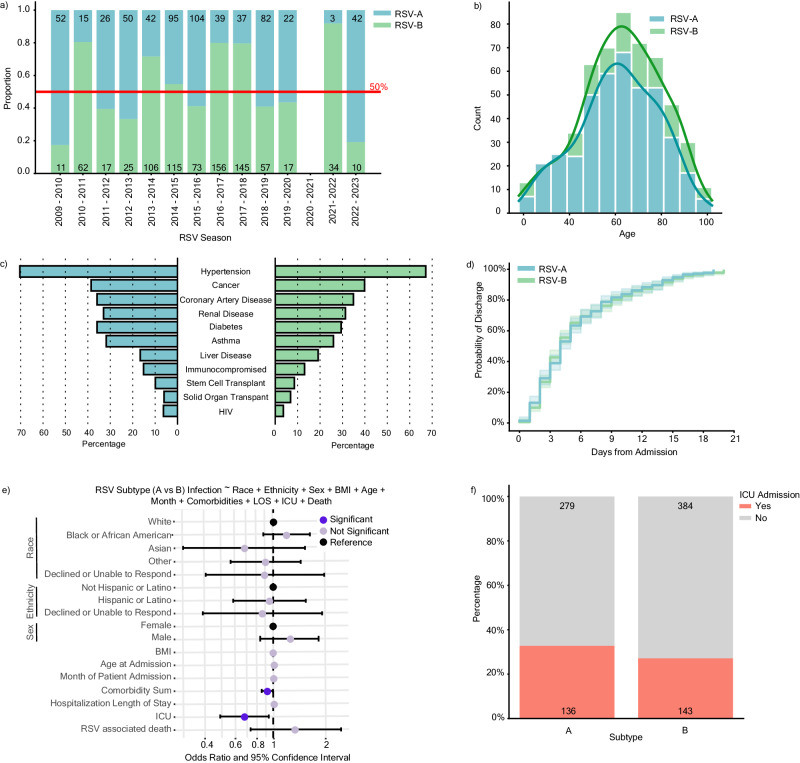
Fig. 3. RSV-A is associated with higher risk of ICU admission.
a Distribution of RSV subtype by season from April 2, 2009 to March 1, 2023 among 1437 outpatient (n = 495) and inpatient (n = 942) adults with typing information as reported by diagnostic platforms or through in-house PCR-based typing [RSV-A in blue (n = 609), RSV-B in green (n = 828)]. b Histogram of the age distribution of adult inpatients stratified by subtype (n = 415 RSV-A and n = 527 RSV-B). c Percent of adult inpatients with the indicated comorbid condition stratified by subtype. d Kaplan–Meier plot depicting the probability of discharge within 20 days of an RSV-associated hospitalization stratified by subtype (n = 377 RSV-A and n = 489 RSV-B). Inpatients with hospital stays longer than 20 days are not shown (n = 76). There is no statistical difference between subtypes by log-rank test (p = 0.620). e Odds ratio plot with 95% confidence intervals (CI) as calculated by a multivariable logistic regression model with RSV-A (reference) or RSV-B infection as the outcome variable for hospitalized adults (n = 942). Significant features (p < 0.05) are highlighted in dark purple (comorbidity sum; 0.025, ICU admission; 0.018), insignificant features (p >= 0.05) are shown in light purple, and reference categories for categorical variables are shown in black (refer to p values in Supplementary Fig. 4A). f Percentage and absolute count of inpatient cohort experiencing ICU admission (yes, orange, n = 279) and either outpatient or hospitalization admission (no, gray, n = 643).

