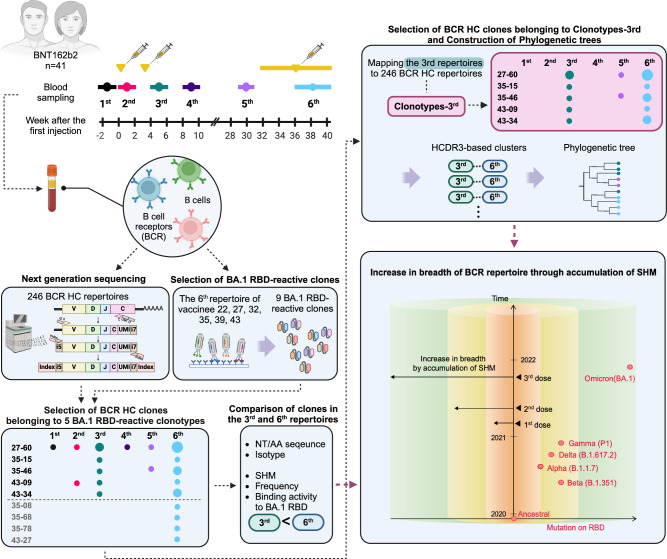
Fig. 1. A comprehensive schematic overview of the study.
Vaccinees received the first two doses at a three-week interval and the third dose between the 31st and 39th weeks after the first dose. Blood was collected six times: pre-vaccination (1st); 1 week after the first dose (2nd); 1, 6, and 30 weeks after the second dose (3rd, 4th, and 5th); and one to four weeks after the third dose (6th). The following illustration provides an overview of the overall study design and analysis. In the last box, the x-axis and y-axis represent mutations on the RBD and a timeline of COVID-19 variants and vaccinations, respectively. The cylindrical plot illustrates the breadth of the BCR repertoire following vaccination. The red dots represent SARS-CoV-2 variants. NT nucleotides, AA amino acids.

