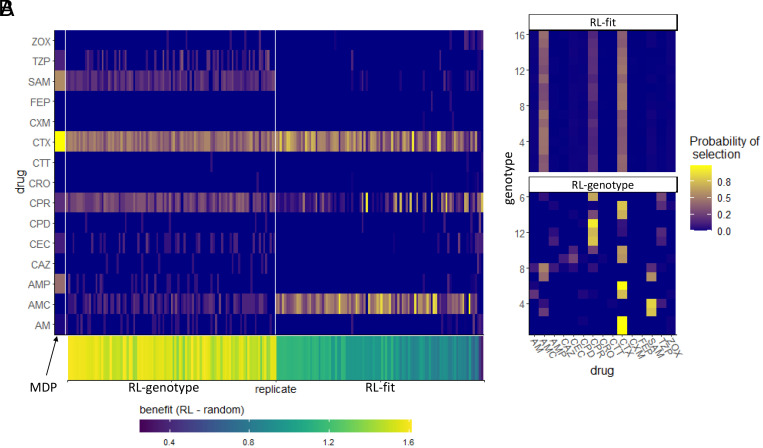
Fig. 3.
Drug cycling policies learned by RL-genotype and RL-fit. (A): Heatmap depicting the learned policy for 100 replicates (on the x-axis) of the RL-genotype and 100 replicates of RL-fit. Far Left column (enlarged) corresponds to the optimal policy derived from the MDP condition. The Y-axis describes the -lactam antibiotics each RL agent could choose from while the color corresponds to the probability that the learned policy selected a given antibiotic. Bottom heatmap shows the median fitness benefit observed under the policy learned by a given replicate. (B) Heatmap showing the average learned policy for RL-fit and RL-genotype. RL-genotype learns a more consistent mapping of genotype to action compared to RL-fit.

