
Fig. 6.
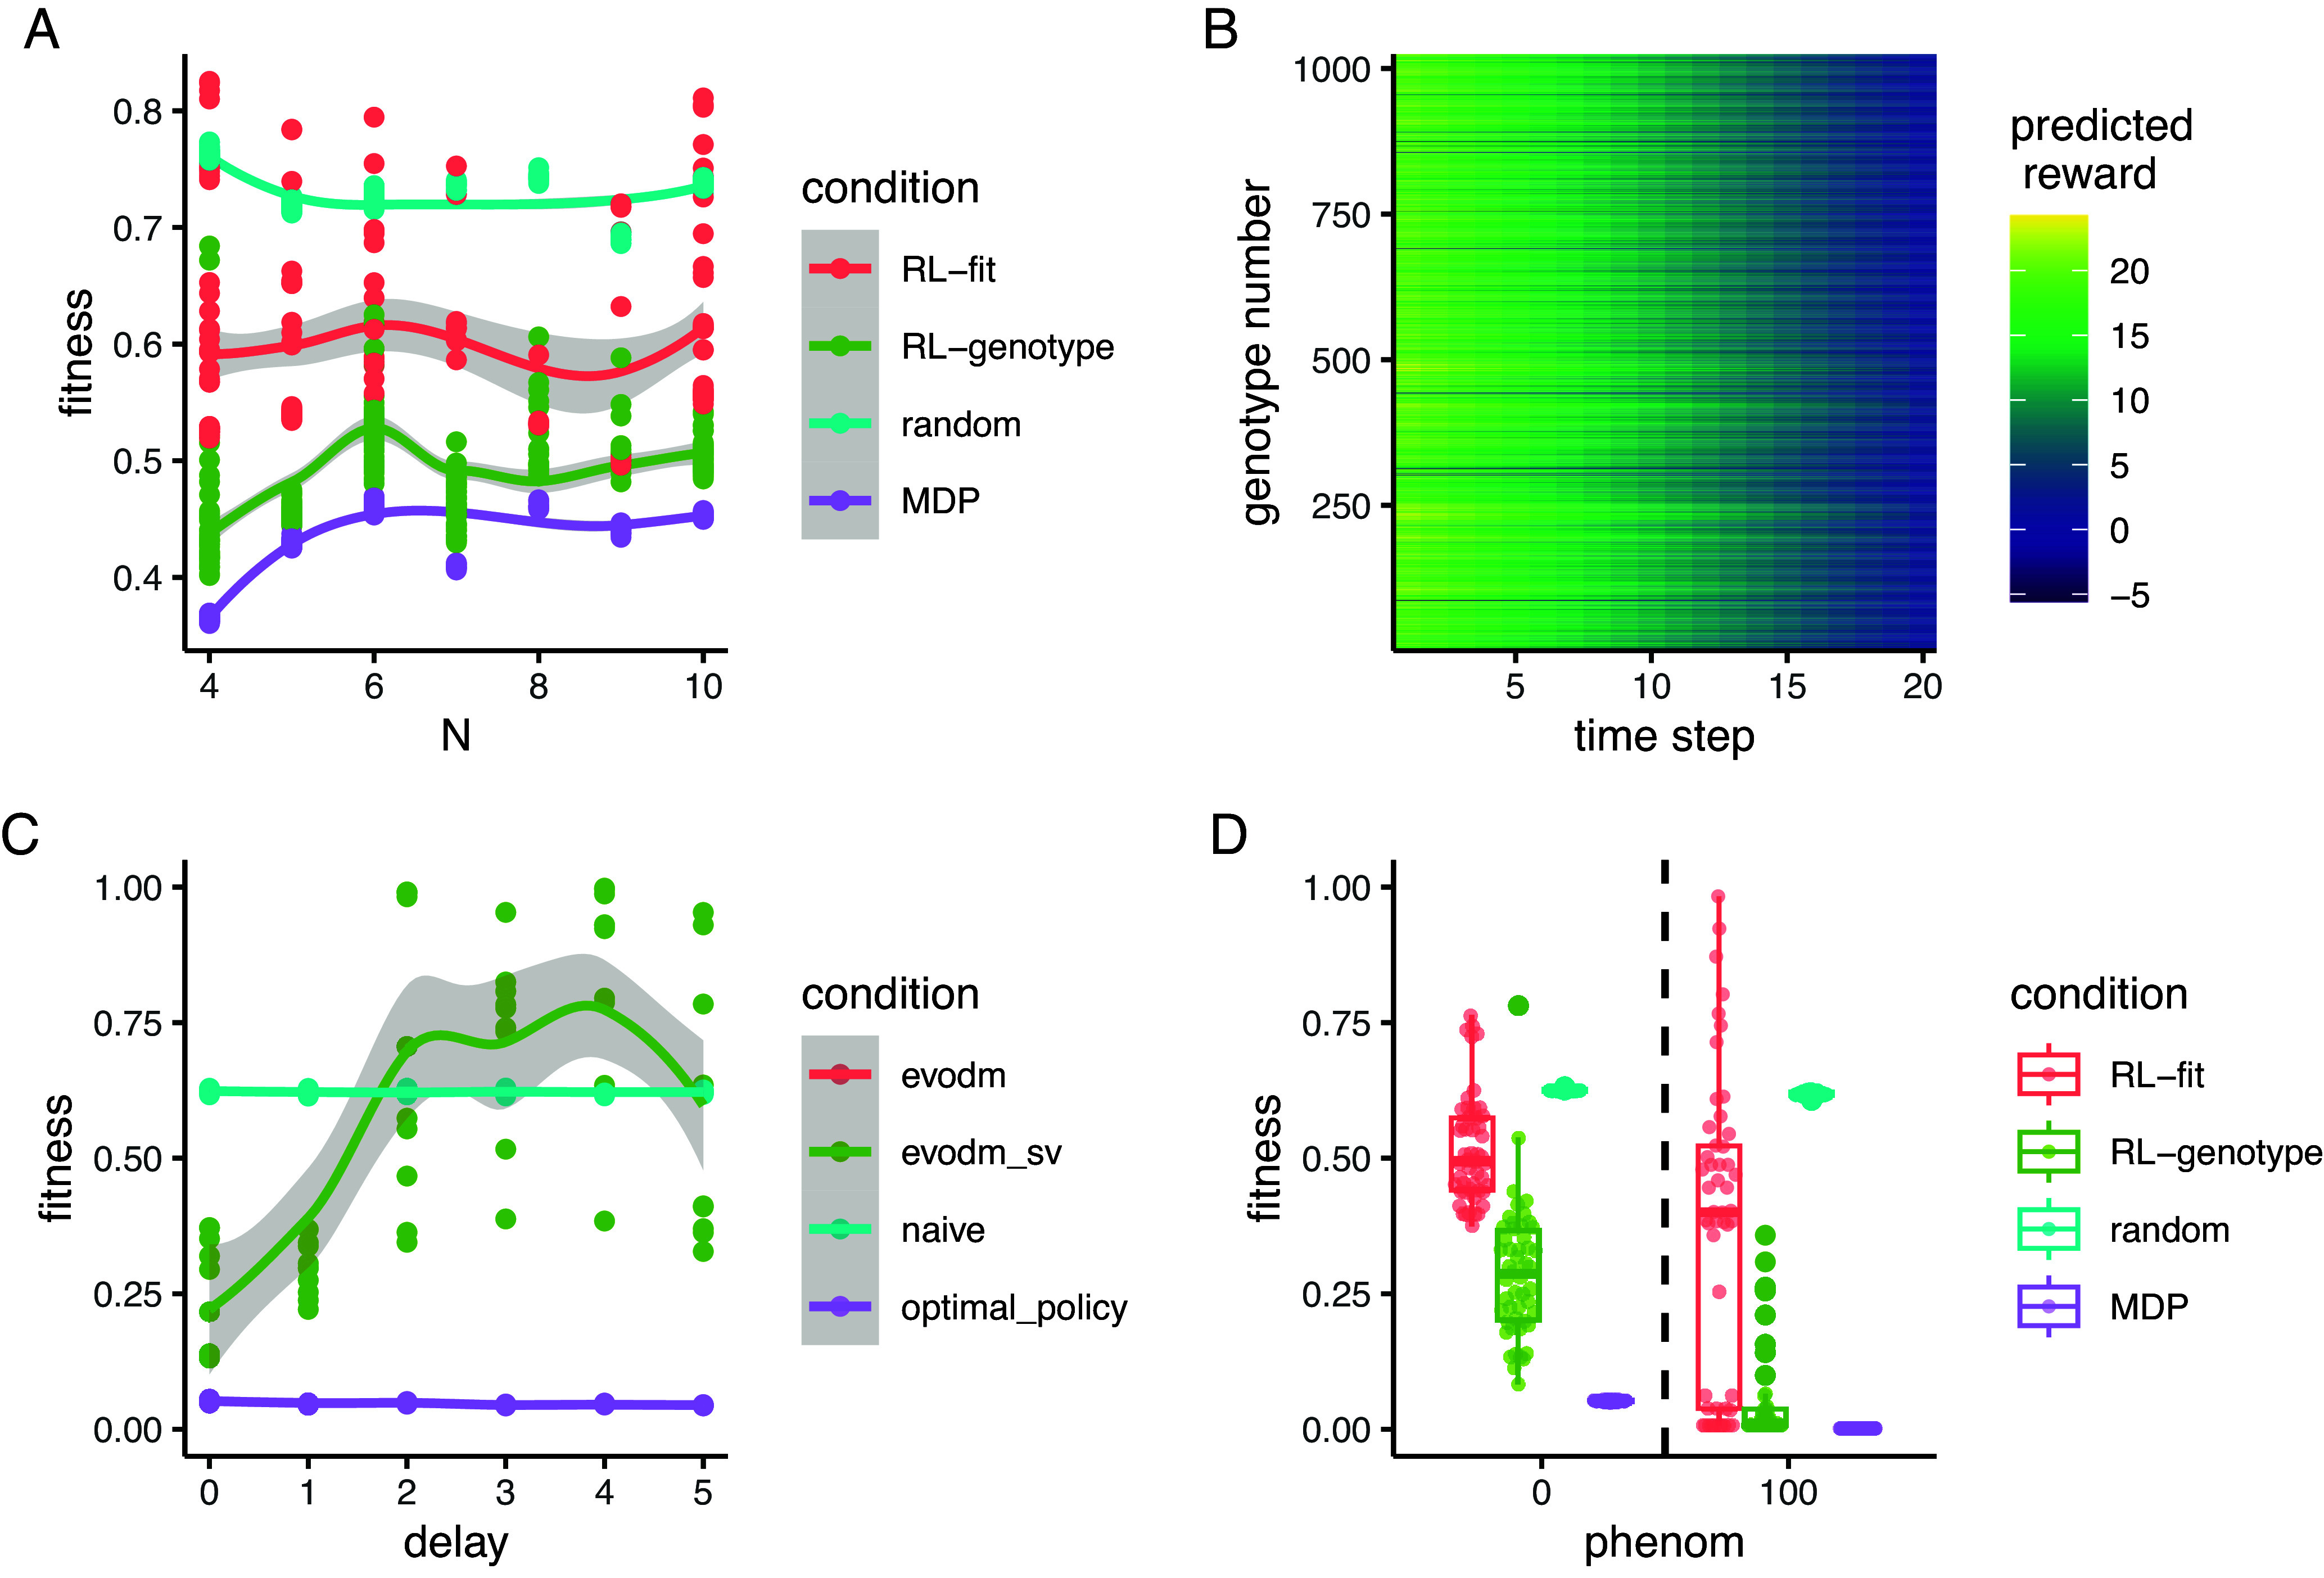
Reinforcement learners learn improved policies, independent of landscape size. (A) Line plot describing the relationship between the number of alleles modeled and the average fitness observed under different policy regimes. The total number of genotypes in a landscape is given by . Each point represents the average fitness of a population under control of an agent trained on the set of landscapes for 500 episodes. The same set of landscapes was used for each condition. (B) Line plot describing the relationship between measurement delay and the observed fitness under different policy regimes. Delay only affects the RL_genotype policy (not the MDP or random conditions). RL_genotype still learned effective policies with a measurement delay of one time step. Performance decayed substantially with additional measurement delays. (C) Boxplot describing the relationship between phenom (a variable corresponding to the likelihood that the population will evolve to the most-fit genotype rather than any more fit genotype) and observed fitness under different policy regimens. (D) Heatmap showing the value function learned by solving the MDP for the landscapes. The Y-axis corresponds to numerically encoded genotype, and the X-axis corresponds to the time step within a given episode. Bright cells correspond to genotypes that were advantageous to the agent while dark cells correspond to genotypes that were disadvantageous to the agent. The value space is rugged, with many peaks and valleys.