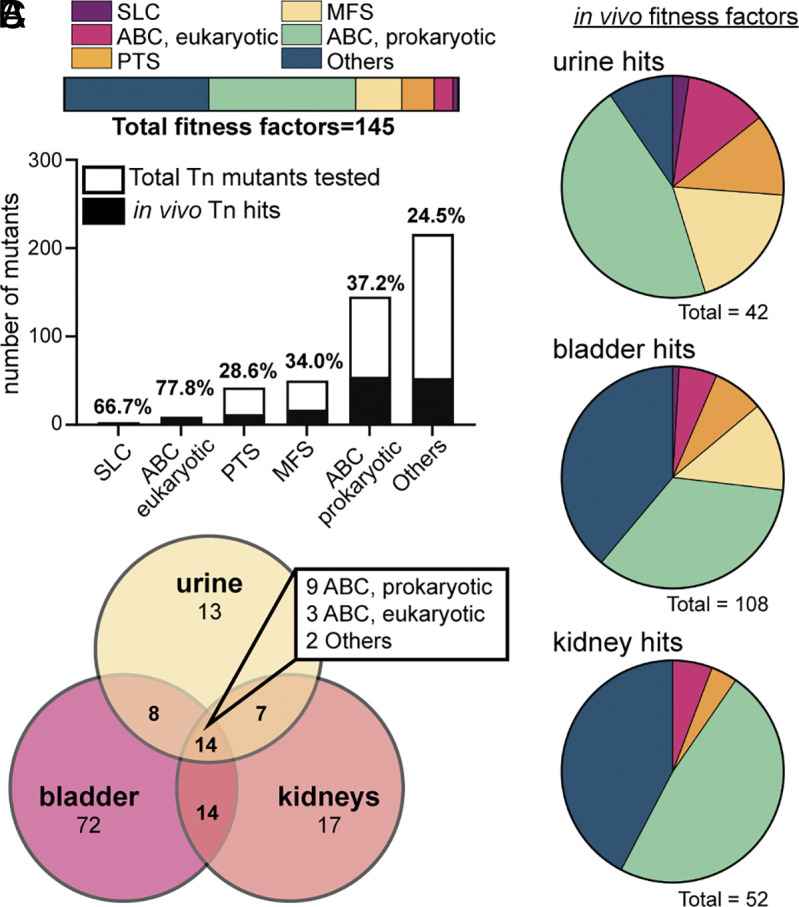
Fig. 2.

Assessing the fitness of transporter mutants in vivo using the murine model of ascending UTI. (A) The genes that are fitness factors in vivo (hits, black bar height) are displayed as a fraction of the total number of transposon mutants used in the experiment (total bar height); exact percentages are indicated above the bar. Transposon mutants were identified as hits in one or more organ sites if Padj < 0.05. In addition, 145 unique mutants were classified as a hit; their assigned families (as a percentage of the total) are represented in the horizontal bar. (B) Each pie chart defines which transporter family each fitness factor is a member of in the indicated organ site. These are color-coded based on the family of transporters: solute carrier (purple), ABC eukaryotic-like (pink), phosphotransferase (orange), major facilitator superfamily (yellow), ABC prokaryotic-like (green), and Others (blue). The total number of mutants displaying fitness defects in that organ site is specified under the chart. (C) The Venn Diagram represents the total number of hits determined from murine urine (yellow), bladder (pink), and kidneys (orange). Many genes were detected as fitness factors in multiple organ sites, and 14 were detected in the urine, bladder, and kidney; the families of these 14 hits are indicated in the box.
