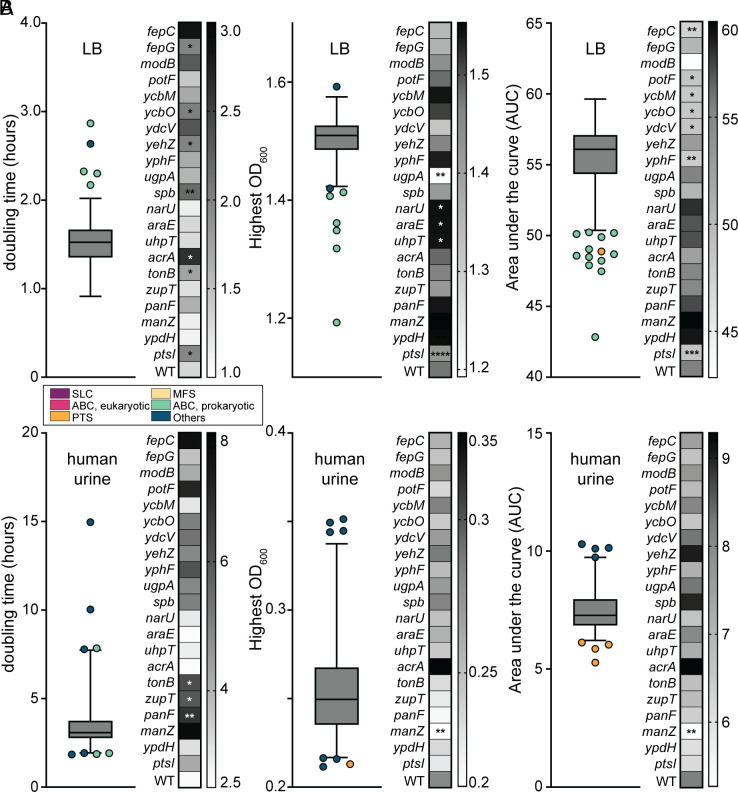
Fig. 3.
Growth defects of transporter mutants in LB and human urine in vitro. All 466 transposon mutants were cultured in (A) LB or (B) human urine (HU), alongside a wild-type control (n = 5). Three metrics were assessed to determine statistical differences in growth trends: doubling time (DT) in hours, saturating OD600, and area under the growth curve (AUC). The data from these screens are displayed as a box and whisker plot, indicating the median and outliers, which are color-coded based on the family of transporters: solute carrier (purple), ABC eukaryotic-like (pink), phosphotransferase (orange), major facilitator superfamily (yellow), ABC prokaryotic-like (green), and Others (blue). A heatmap display accompanies these data to show the strains and their values in direct comparison to the wild-type. One-way ANOVA was performed using Dunnett’s multiple-test correction. *P < 0.05, **P < 0.01, ***P < 0.001, ****P < 0.0001.

