
Fig. 1.
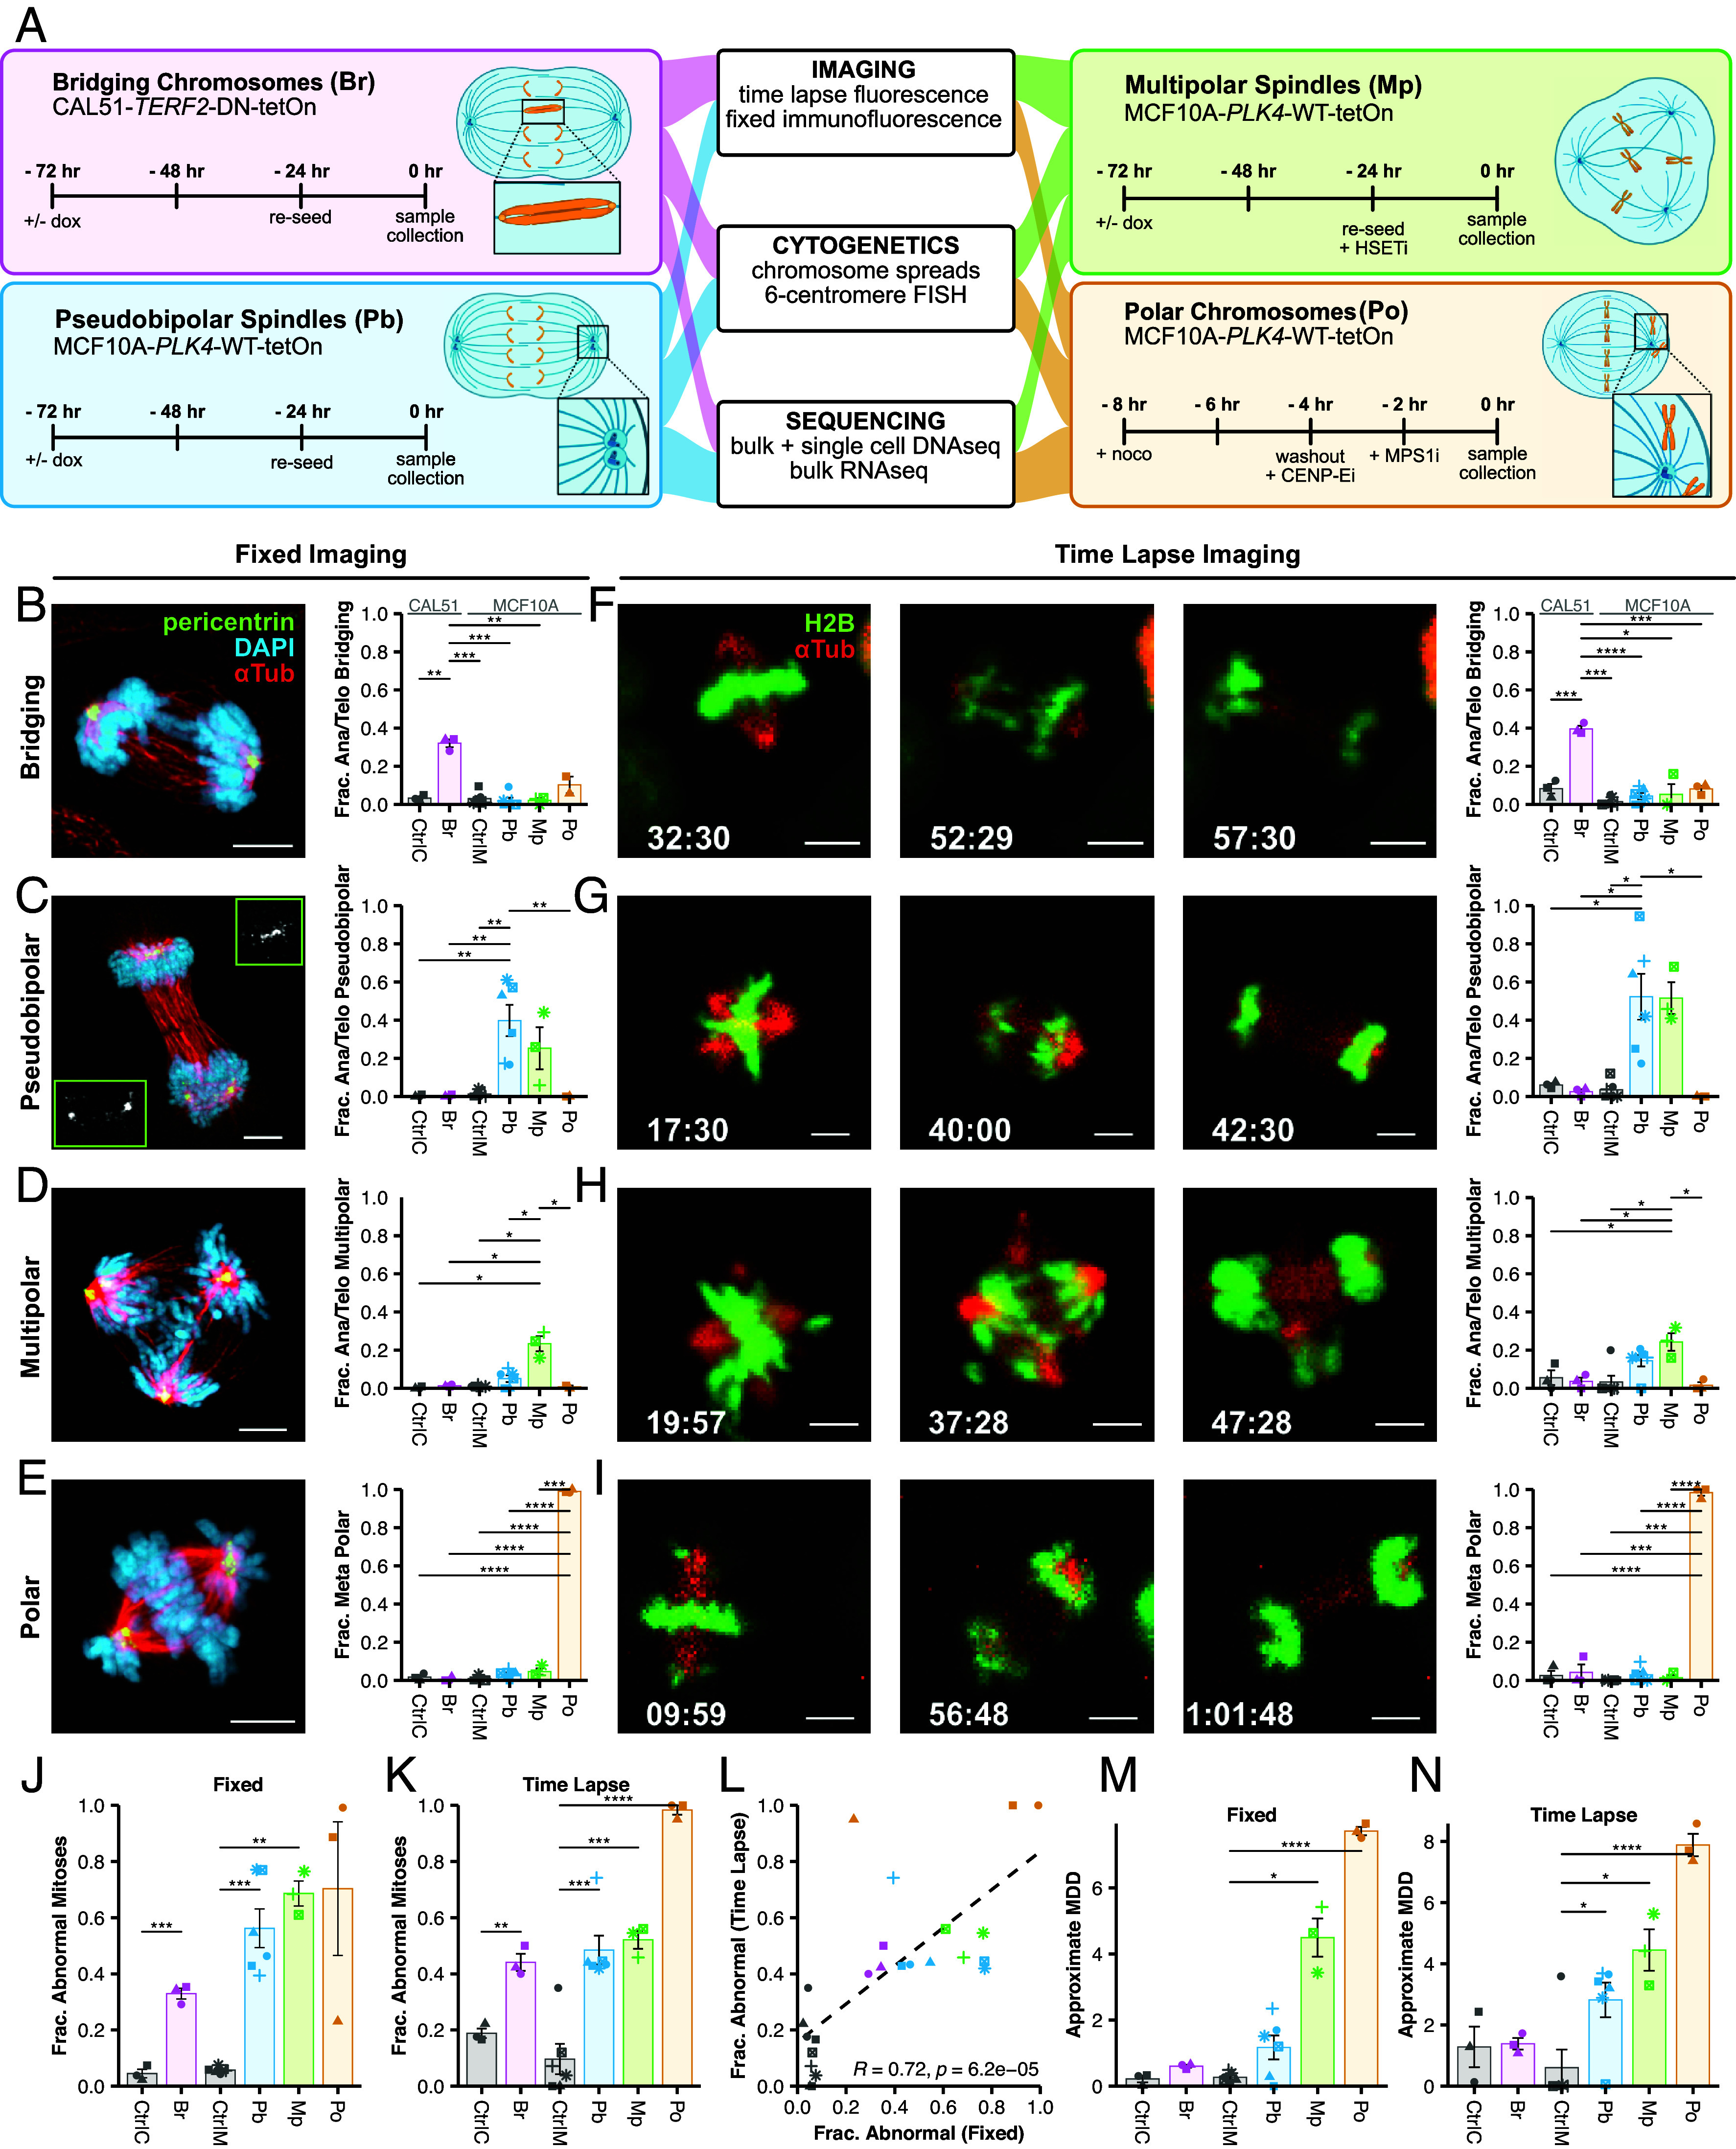
Inducible CIN models validated by imaging. (A) Inducible models of CIN phenotypes. Bridging chromosomes (Br), Pseudobipolar (Pb), Multipolar spindles (Mp), and Polar chromosomes (Po). Br, Pb, and Mp were treated with doxycycline for 72 h before harvest. Po cells used for mitotic chromosome spreads and centromeric cenFISH were washed out at T-0 and harvested 24 h later after a 2 h 50 ng/mL colcemid treatment. (B–E) Representative images of specific CIN phenotypes and observed incidence by fixed immunofluorescence or (F–I) time lapse fluorescence imaging. (J) Fraction of abnormal mitoses by fixed immunofluorescence or (K) time lapse fluorescence imaging. P < 0.05 (*), <0.01 (**), <0.001 (***), and <0.0001 (****). (L) Correlation between fixed immunofluorescence and time lapse imaging with Pearson correlation coefficient; α = 0.01. (M) MDD estimates from fixed imaging. (N) MDD estimates from time lapse. MDD values were approximated as the sum of phenotype specific MDD values for each condition (SI Appendix, Table S2). Colors represent the biological replicate; bars and error bars indicate mean and SE. Significance values are from a two-tailed, two-sample Student’s t tests corrected by the Benjamini–Hochberg method. For time lapse imaging, N ≥ 20 cells for each of ≥3 biological replicates, except single replicates of CtrlC and Pb. For fixed imaging, N ≥ 50 metaphase and ≥anaphase/telophase cells for each of ≥3 biological replicates, except single replicates of CtrlM, Pb.