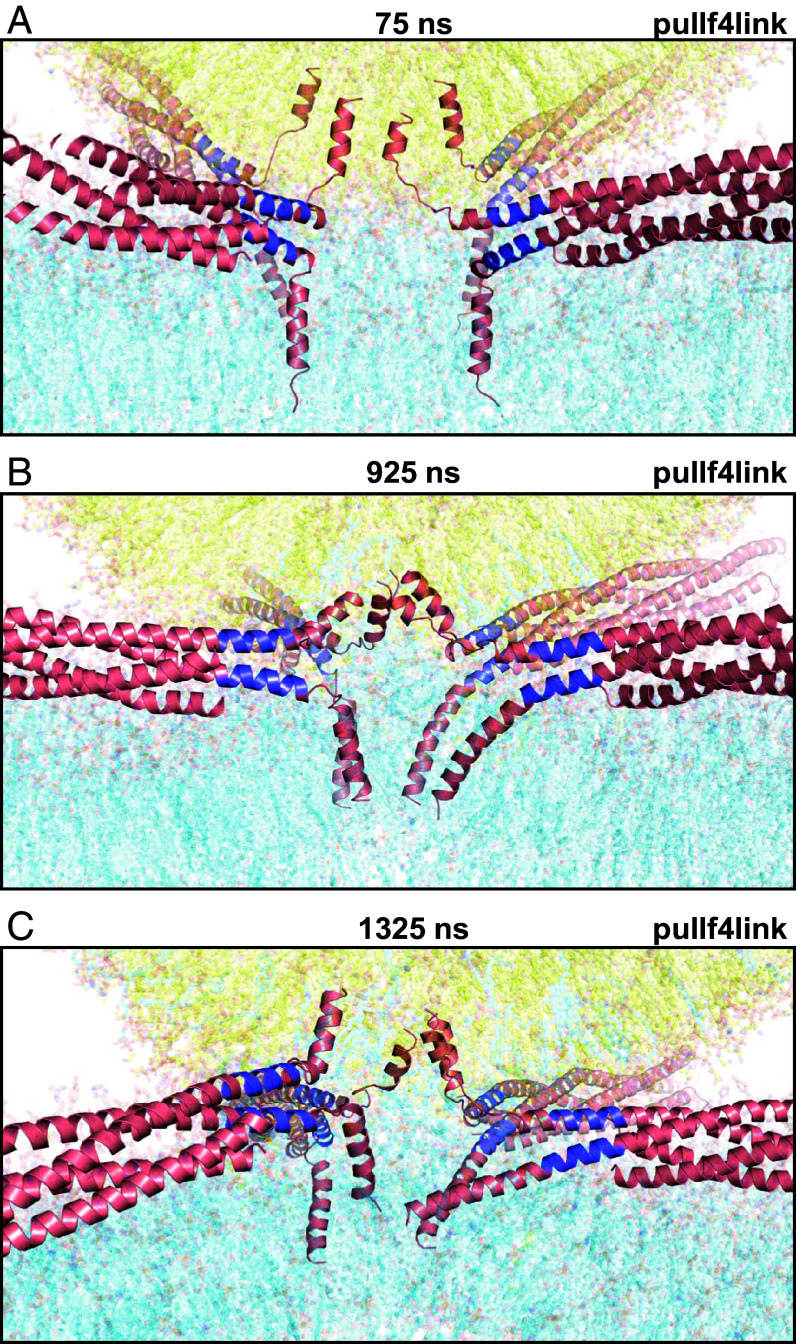
Fig. 5.
Snapshots taken at 75 ns (A), 925 ns (B) and 1325 ns (C) of the pullf4link simulation illustrating the conformational changes in the SNAREs as the system evolved from bilayer-bilayer contact to the fusion pore. SNARE complexes are represented by ribbon diagrams and lipids are represented by 90% transparent sticks to allow visualization of the ribbons. Note that the thickness of the slices shown in these panels is much larger than those of the slices shown in Figs. 3 and 4 and SI Appendix, Figs. S8 and S9 so that all four trans-SNARE complexes can be observed, but the lipids then need to be transparent to allow visualization of the SNAREs. Additional snapshots are shown in SI Appendix, Fig. S10. The color code is the same as in Fig. 1.

