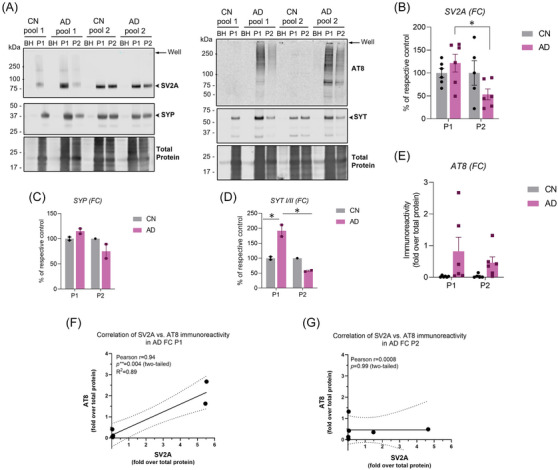
FIGURE 6.

Immunoblot analyses in CN and AD brain BHs, P1, and P2 fractions. Immunoblot analyses for synaptic proteins SV2A, SYP, STY I/II and p‐tau (AT8) were performed in the BH, P1, and P2 fractions prepared from the frontal cortex brain tissue homogenates from CN and AD patients. (A) Representative immunoblots probed for synaptic proteins SV2A (93 kDa), SYP (38–48 kDa), SYT (65–67 kDa), and p‐tau in BH, P1, and P2 fractions prepared from CN and AD brains. Single arrows indicate the gel well. (B–E) Quantification of SV2A, SYP, STY I/II, and p‐tau (AT8) band intensity in CN and AD P1 and P2 fractions. Band intensity was quantified using LI‐COR Empiria software and signal was normalized to total protein stain (LICOR). Protein expression levels are displayed as means ± SEM of either percentage (%) of respective CN or fold‐over total protein and analyzed using two‐way ANOVA (Tukey's test). * p < 0.05. (F–G) Association between SV2A and AT8 immunoreactivity in AD P1 and P2 fractions were analyzed using Pearson correlation coefficient. The solid line represents the linear regression curve along with dotted line showing the 95% confidence interval. AD, Alzheimer's disease; CN, control; FC; frontal cortex; SV2A, synaptic vesicle protein 2A; SYP, synaptophysin; SYT I/II, synaptotagmin I/II.
