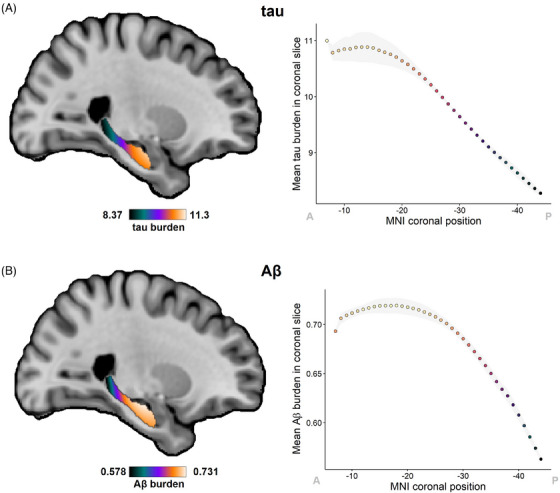
FIGURE 5.

Distribution of tau and Aβ pathology burdens along the hippocampal long axis. (A) Distribution map for tau pathology, quantified as the percentage of NFTs over the total neuron count, obtained with Path2MR. Mean tau burden per coronal slice of this map is shown on the right. (B) Distribution map of Aβ burden, quantified as percentage area covered by Aβ plaques, together with plot of mean burden for every coronal slice. In graphs on the right, the gray shade shows standard deviation, and MNI coordinates have been reversed to ease visualization from anterior (A) to posterior (P). Aβ, amyloid beta; MNI, Montreal Neurological Institute; NFT, neurofibrillary tangle
