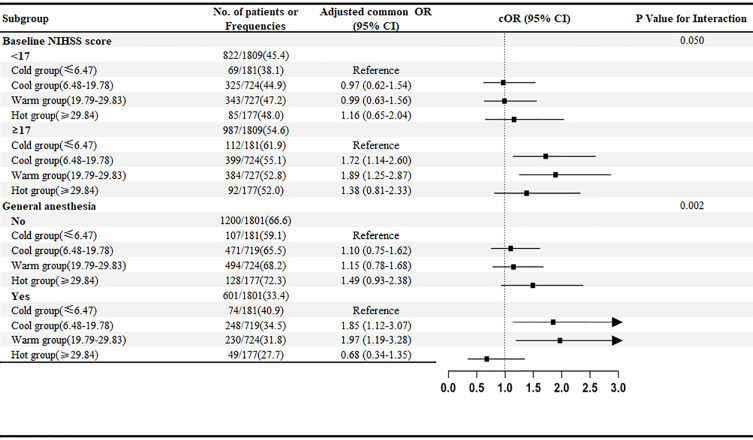
Figure 3.
The forest plot displays effect variation across subgroups for the adjusted common odds ratio of less disability at 90 days as compared with the Cold group. The forest plot displays effect variation across 11 subgroups for the adjusted common odds ratio of less disability at 90 days. A lower modified Rankin Scale (mRS) score indicates less disability. The thresholds for age, baseline National Institutes of Health Stroke Scale score (NIHSS), and onset to recanalization time were chosen at the median. Adjusted odds ratio (95% CI) > 3 indicated by arrows.

