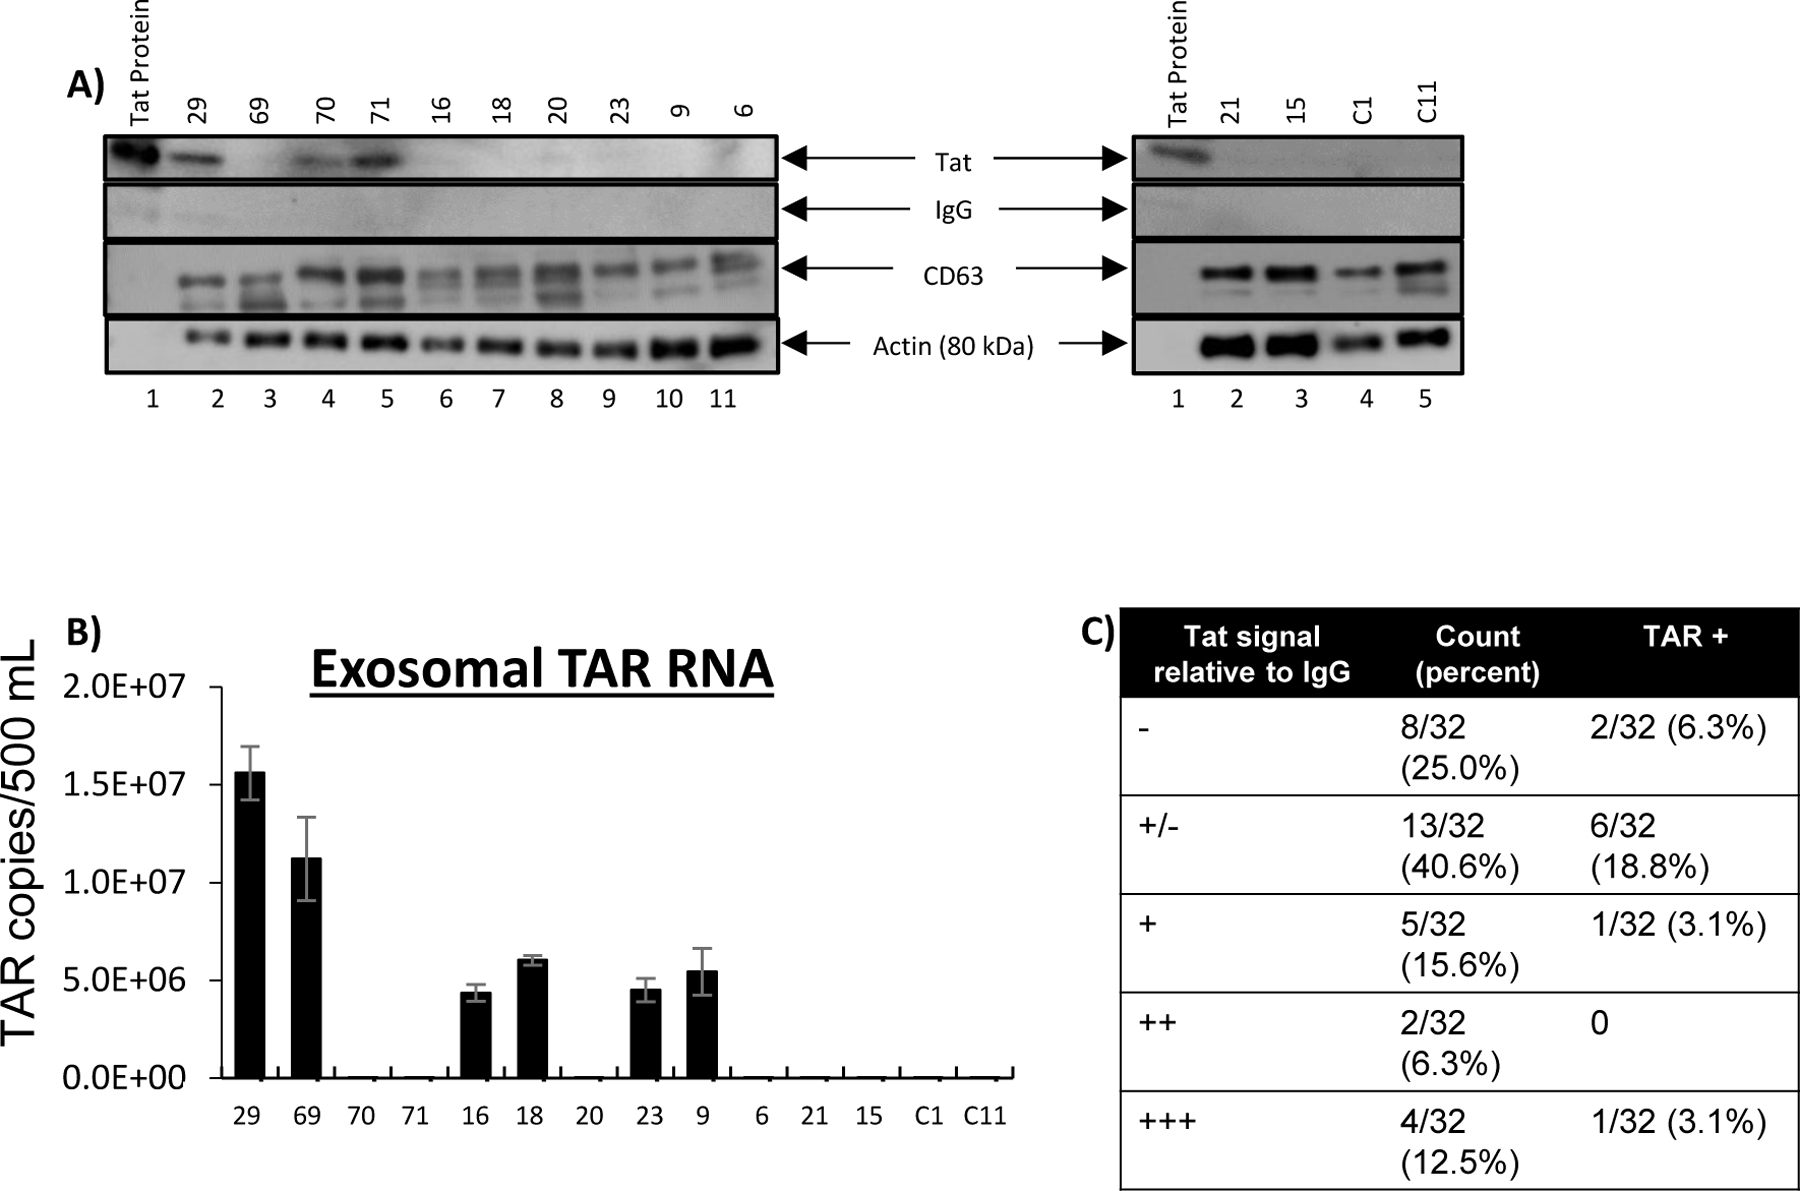
Figure 2. Presence of Tat protein and TAR RNA in exosomes isolated from CSF.

A) Immunoblot of isolated exosomes for the Tat protein, the exosome marker CD63, actin (loading control), and IgG (negative control) for background subtraction. The top of the image shows patient identification number and the bottom of the image indicates lane number.C1 and C11 are control samples from HIV seronegative patients. B) Levels of TAR RNA were measured in CSF exosomes by quantitative RT-PCR. Results indicate copies of TAR per 500 μl of CSF used for exosome isolation. Error bars represent ± S.D. of three technical replicates. C) Summary of exosome data showing number of patient samples positive for Tat protein and/or TAR RNA. Results shown in Tat column represent western blot densitometry relative to negative IgG control: - = <1%; +/− = 1%−14.99%; + = 15%−32.99%; ++ = 33%−65.99%; +++ = >66%. “TAR+” column indicates the number of patient samples positive for TAR RNA in each Tat category.
