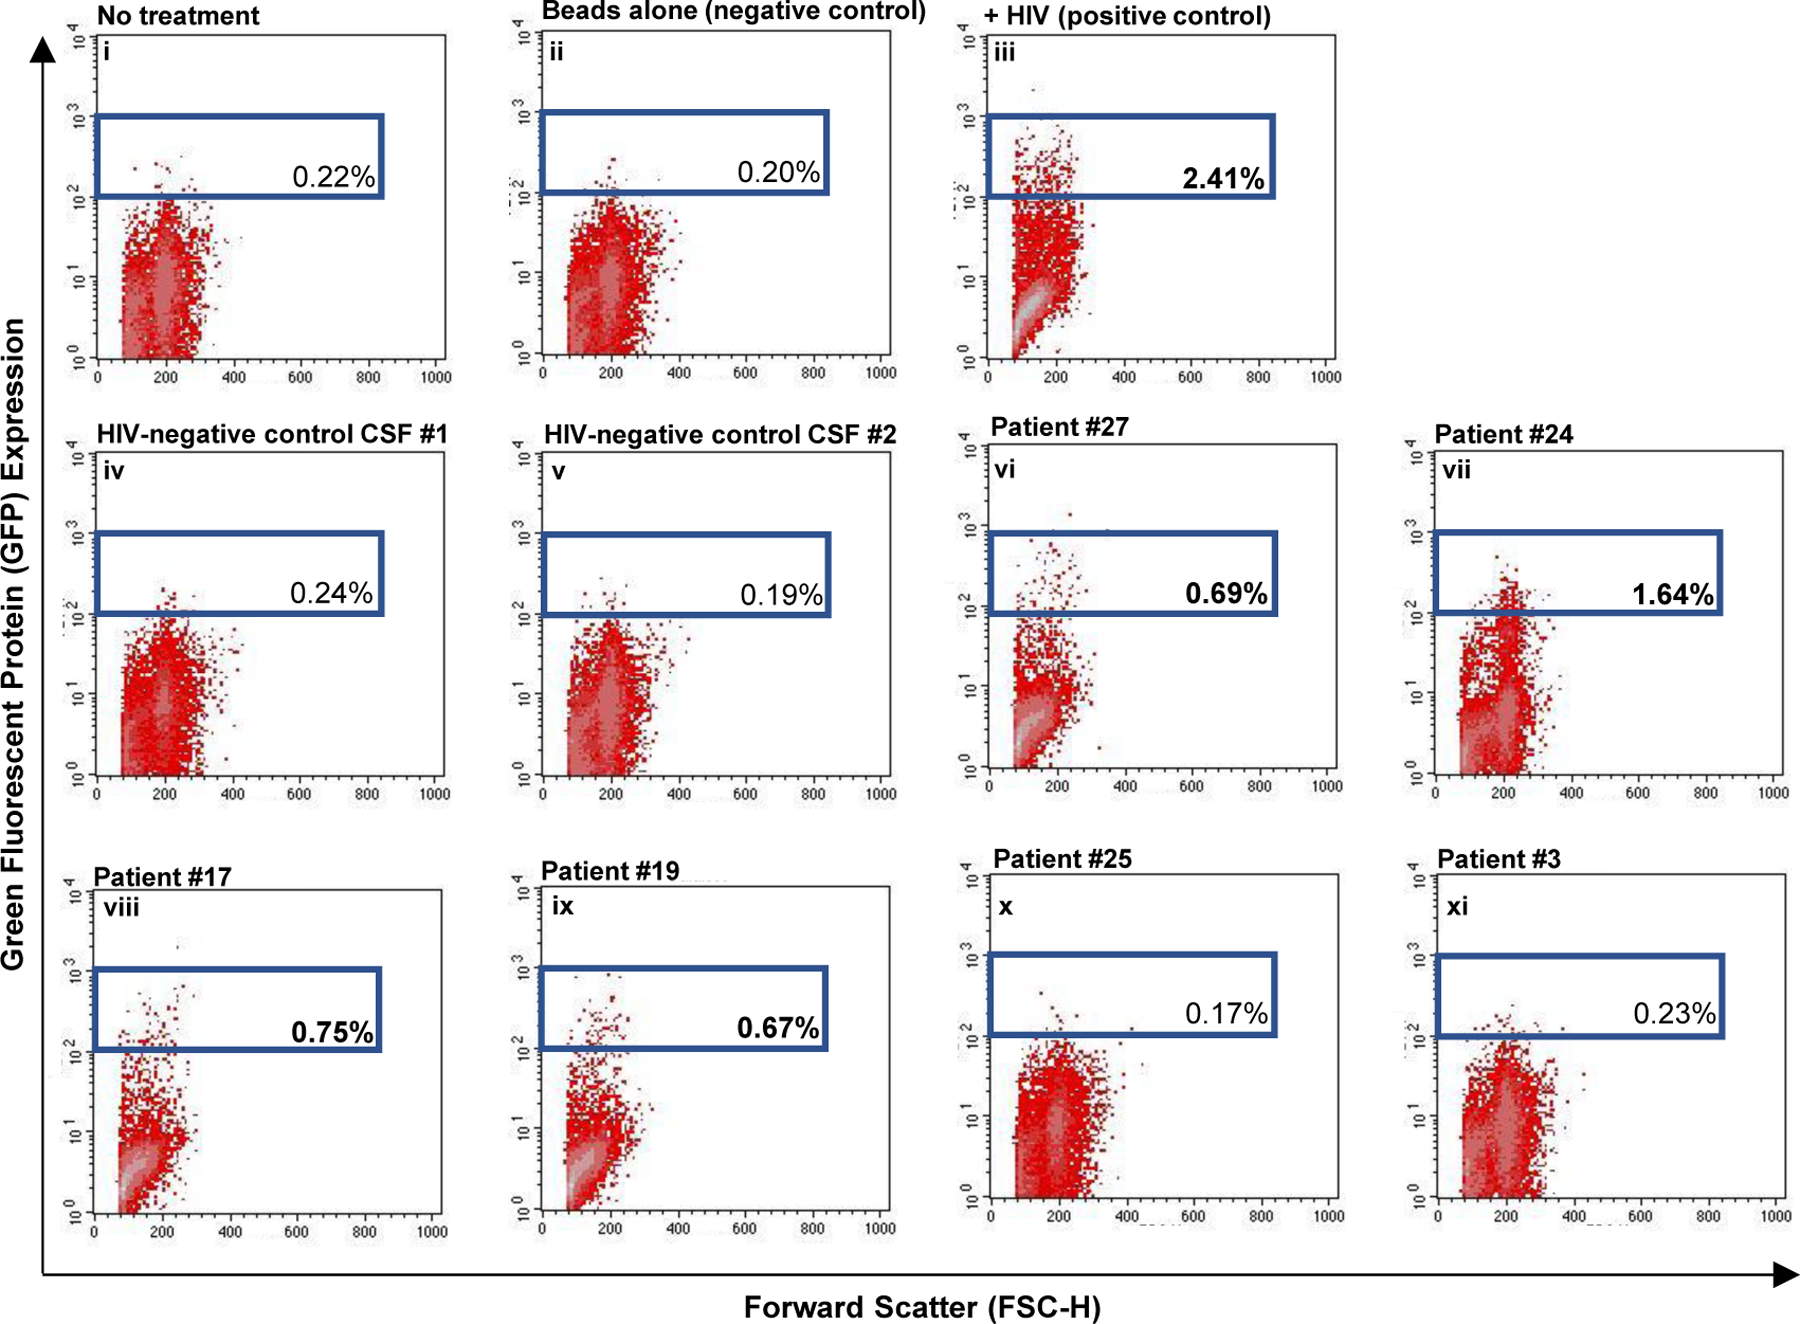
Figure 3. Tat protein isolated from CSF exosomes is capable of transactivating the HIV promoter.

Scatter plots showing collected flow cytometry data. Side scatter is on the X-axis and GFP is on the y-axis. Exosomes from HIV-negative controls (control CSF #1, control CSF #2) or HIV-positive patients with detectable CSF Tat as measured by western blot (#27, #24, #17, #19, #25, #3) were directly added to CEM-GFP reporter cells, which contain a GFP gene under the control of an HIV promoter. 72 hours later, flow cytometry was used to detect GFP expression. As a positive control, cells were infected with HIV. Cells with no treatment or treatment with beads alone were used as negative controls. Sample ID is indicated in the top right corner and the gated number represents the percent of GFP-positive cells for a given sample. Bolded numbers indicated samples with gated events that exceed the negative control.
