
Fig. 3.
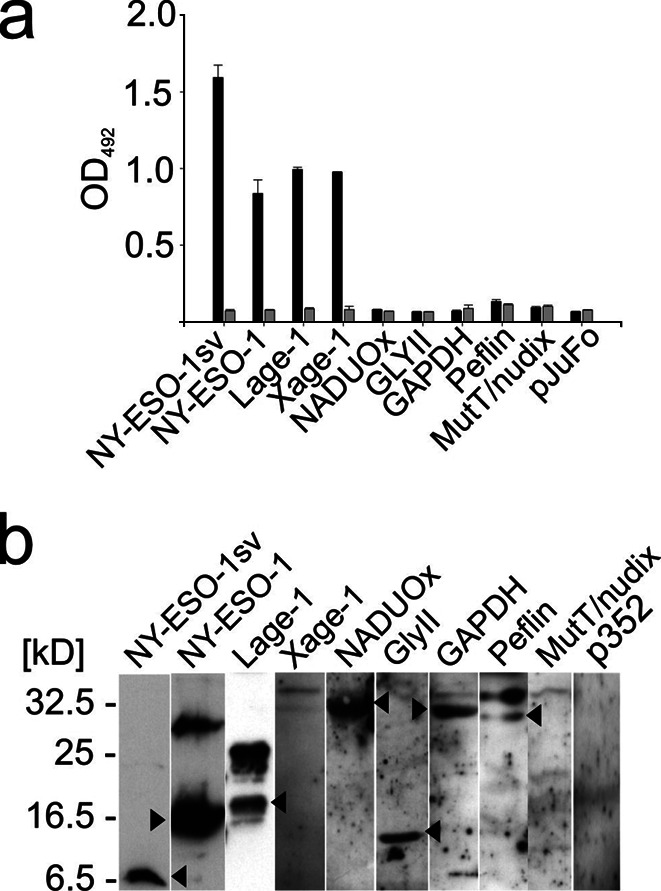
a ELISA reactivity of individual phage clones with autologous serum MD2 (black bars) and normal serum (gray bars) diluted 1:100. Vertical lines denote standard error of 2 experiments. b Western blotting of recombinant proteins encoded by selected phages using MD2 serum diluted 1:100. Size markers are indicated to the left. Lanes 1–3 (from left) are exposed for a shorter time than lanes 4–10. Top band in lanes 4, 7, 8, and 9 represents background E. coli protein. Arrows indicate reactive proteins. Parallel filters hybridized to one normal serum diluted 1:100 did not show similar reactivity (data not shown)