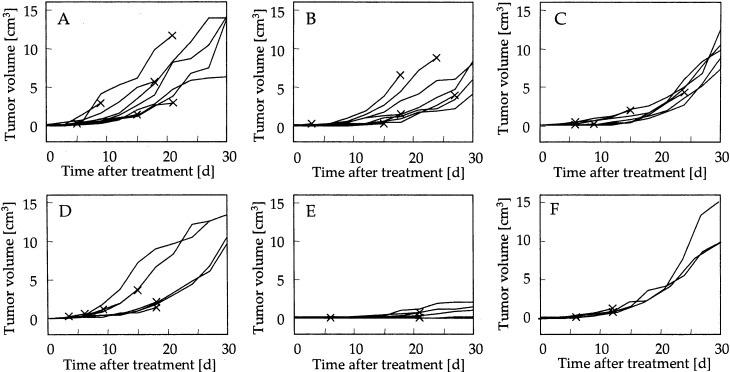
Fig. 2A–F.
Antitumor effects of administration of rmHSP70 combined with hyperthermia. Time courses of tumor growth after MCL injection in nontreatment (A, n=10), hyperthermia treatment alone (B, n=10), rmHSP70 (80 μg) injection alone (C, n=10), rmHSP70 (20 μg) injection plus hyperthermia treatment (D, n=10), rmHSP70 (80 μg) injection plus hyperthermia treatment (E, n=10), and rmHSC70 (80 μg) plus hyperthermia treatment (F, n=6) groups. Each line represents tumor growth in a single mouse. Crosses indicate when each mouse died

