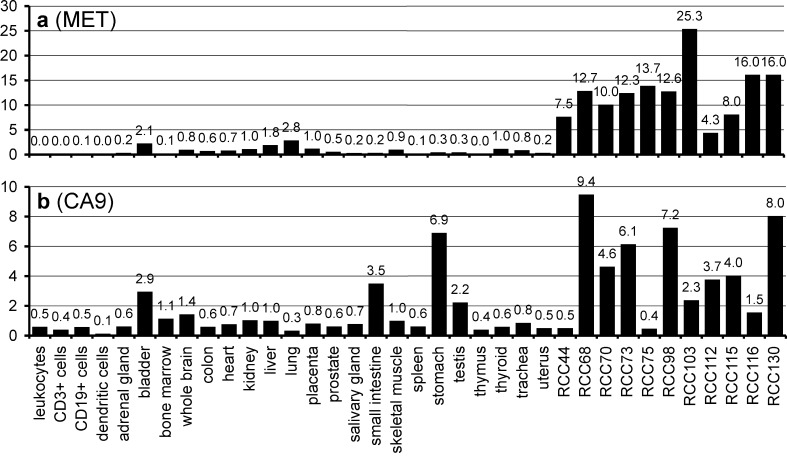
Fig. 2.
mRNA expression profiles of met proto-oncogene (MET) (a) and carbonic anhydrase 9 (CA9) (b) in 11 analyzed RCCs and various human tissues. Relative expression values are normalized to kidney (expression=1). MET appeared highly overexpressed in all tumors, CA9 was overexpressed over kidney in most tumors, while stomach and small intestine also showed high expression of CA9

