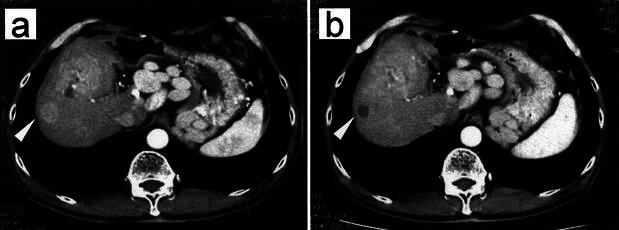
Fig. 3a, b.

Clinical response to DC vaccination. CT scan of patient no. 7 with recurrent tumors located at S5 and S7 (white arrow) before (a) (enhanced area 13 mm in diameter) and after (b) (low density area 7 mm in diameter) eight immunizations with tumor lysate and KLH-pulsed DCs
