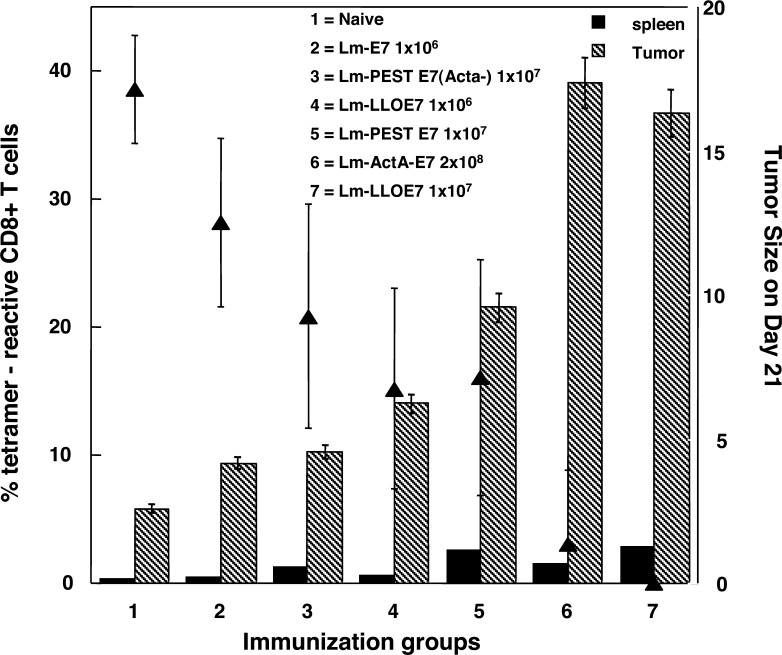
Fig. 7.
Frequency of CD8+ T cells in the spleen and tumors of C57BL/6 mice treated with different Listeria constructs. The dose of vaccine injected i.p into each mouse is the value for LD50 as indicated next to the construct name. The solid triangles represent the average tumor diameter at day 21, following tumor implantation s.c at day 0 and vaccine doses at days 7 and 14. The hatched bars represent the percentage of E7 tetramer+ CD8+ T cells at day 21 in the tumor and the solid bars represent those in the spleen. All numbers are an average from eight mice in vaccine group. Numbers 1–7 indicate the different vaccines used in this experiment. Lm-E7 and Lm-LLO-E7 are described in [3]; Lm-ActA-E7 is described in [23]; Lm-PEST-E7 is described in Sewell et al. (2004) Cancer Res 64:8821--8825. Lm-PEST-E7 (ActA-) is similar to Lm-Pest-E7 except that the host Listeria strain has the ActA gene deleted

