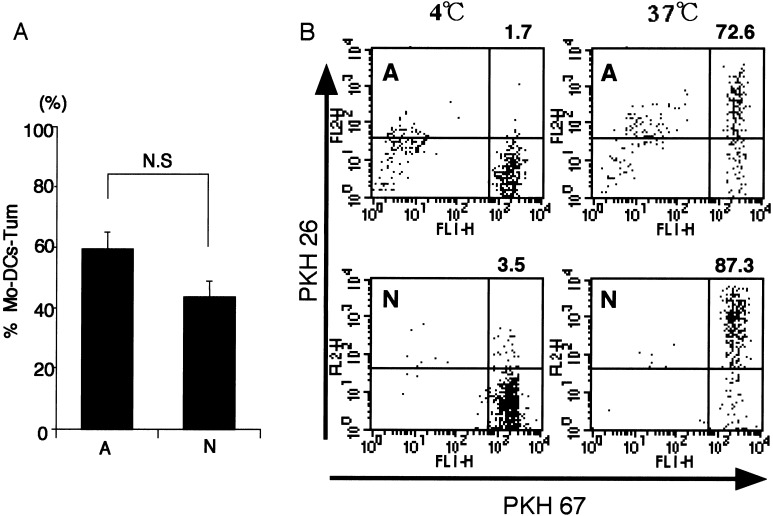
Fig. 1a,b.
Analysis of dead tumor cells by Mo-DCs. a Dead tumor cells were cocultured with an equivalent number of Mo-DCs for 4 h and then stained with Giemsa. One hundred Mo-DCs were examined under a light microscope, and the percentage of Mo-DCs-Tum was calculated (%Mo-DCs-Tum). Results are presented as mean ± SE (bars). The data are representative of three independent experiments using Mo-DCs generated from ten different donors. b Membrane components of dead tumor cells were labeled with PKH 26, and Mo-DCs were labeled with PKH 67. Fluorescence-labeled Mo-DCs were cocultured with dead tumor cells at a ratio of 1:1 for 4 h at 4°C or 37°C. Data are the log fluorescence intensity of Mo-DCs gated by cellular size and granulation phenotype. Fluorescence profiles of Mo-DCs-Tum at 4°C or 37°C are shown. The percentage of double-positive (PKH 26+, PKH 67+) Mo-DCs is shown in the upper right corner of each figure. The data are representative of three independent experiments using Mo-DCs generated from three different donors

