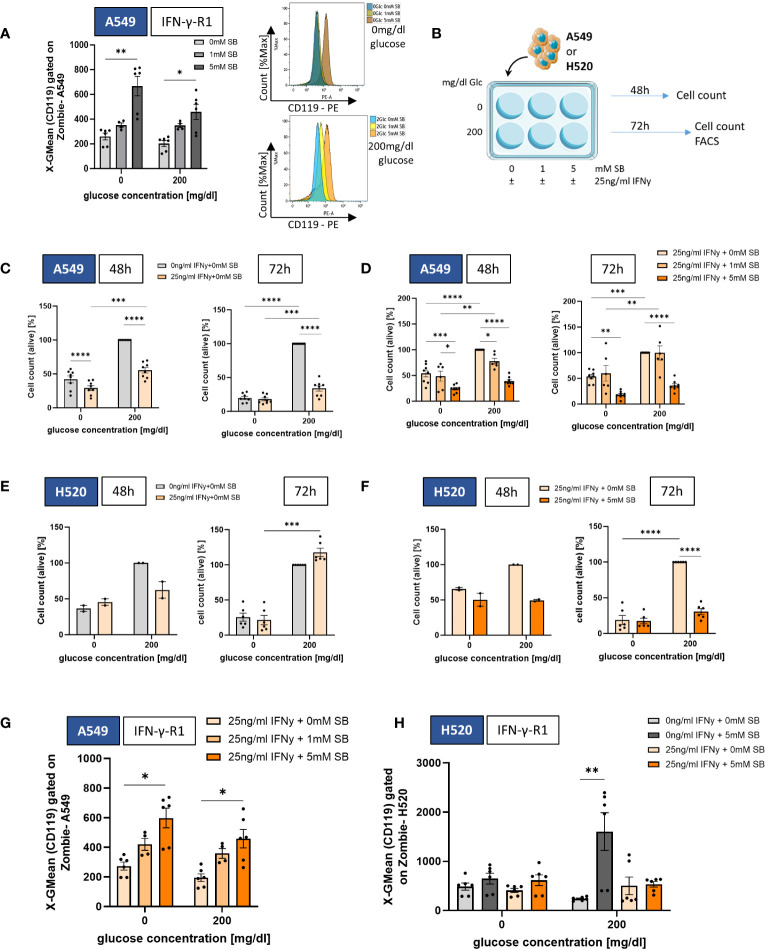
Figure 2.
SB induced IFN-γ-R1 surface expression and reduced cell viability in combined treatment with rhIFN-γ. (A) Geometric mean of CD119 expression on A549 cell surface after 72h cell culture with 0, 1 and 5mM SB treatment and corresponding histograms without glucose (top) and with 200mg/dl glucose (bottom), analyzed by flow cytometry, (n=6); (B) Schematic illustration of the experimental design. 5x10⁵ A549 or H520 cells per well were incubated for 48h or 72h with 200mg/dl glucose or without and SB concentrations increased from 0mM over 1mM to 5mM SB with additionally 25ng/ml rhIFN-γ; (C) Percentages of the cell count of living A549 cells stained with trypan blue solution after 48h or 72h of rhIFN-γ treatment in relation to the norm population (200mg/dl glucose, 0ng/ml rhIFN-γ, 0mM SB), (n=8); (D) Percentages of the cell count of living A549 cells stained with trypan blue solution after 48h or 72h of SB and rhIFN-γ treatment in relation to the norm population (200mg/dl glucose, 25ng/ml rhIFN-γ 0mM SB), (n=8); (E) Percentages of the cell count of living H520 cells stained with trypan blue solution after 48h (n=2) or 72h (n=6) of rhIFN-γ treatment in relation to the norm population (200mg/dl glucose, 0ng/ml rhIFN-γ 0mM SB); (F) Percentages of the cell count of living H520 cells stained with trypan blue solution after 48h (n=2) or 72h (n=6) of rhIFN-γ and SB treatment in relation to the norm population (200mg/dl glucose, 25ng/ml rhIFN-γ 0mM SB; (G) Geometric mean of CD119 expression on A549 cell surface after 72h cell culture, with 25ng/ml rhIFN-γ and additional 0, 1 and 5mM SB treatment and analyzed by flow cytometry, (n=6); (H) Geometric mean of CD119 expression on H520 cell surface after 72h cell culture (n=6). (*P < 0.05; **P < 0.01; ***P < 0.001; ****P < 0.0001). One-way ANOVA test was used for figure (C, D, F), Kruskal-Wallis test was used for figure (A, E, G, H) All data are presented as mean values ± SEM. Parts of the figure were drawn by using pictures from Servier Medical Art and is licensed under a Creative Commons Attribution 3.0 Unported License (https://creativecommons.org/licenses/by/3.0/).

