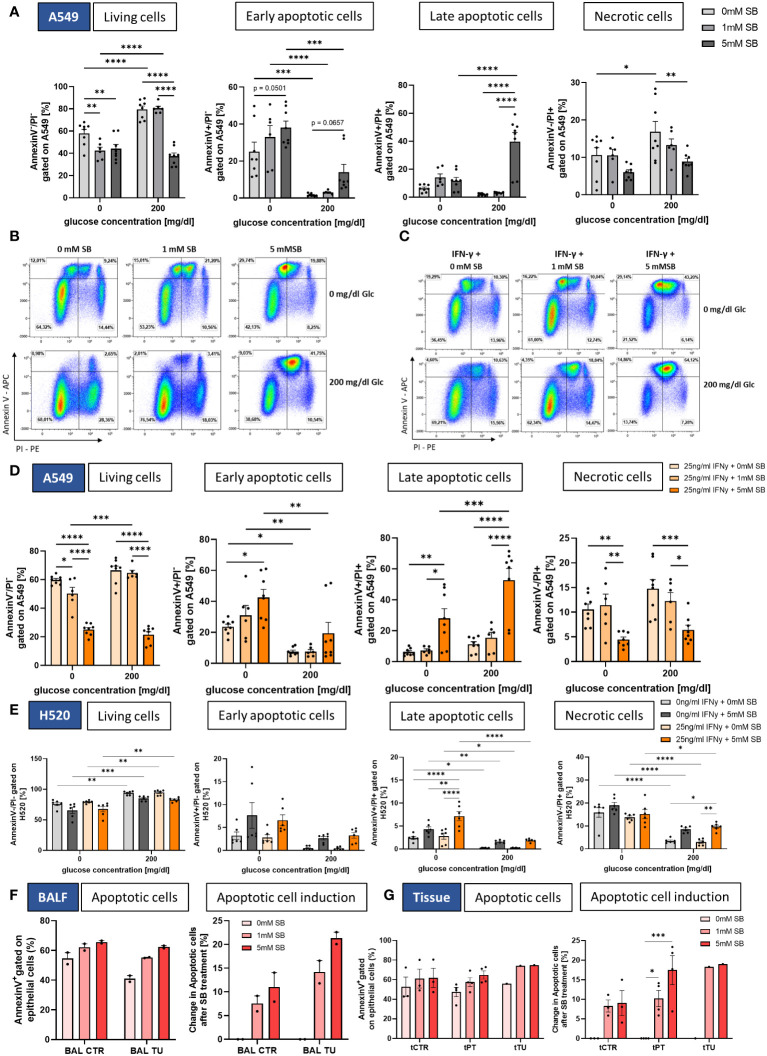
Figure 3.
SB induced apoptosis in lung cancer cell lines and NSCLC-patient-derived cells. (A) Percentages of Annexin V/PI FACS analysis of A549 cells: living cells (Annexin V- PI-), early apoptotic cells (Annexin V+ PI-), late apoptotic cells (Annexin V+ PI+) and necrotic cells (Annexin V- PI+), (n=8); (B) Dotplots of Annexin V/PI FACS analysis of A549 cells after treatment with SB; (C) Dotplots of Annexin V/PI FACS analysis of A549 cells after treatment with rhIFN-γ and SB; (D) Percentages of Annexin V/PI FACS analysis of living cells (Annexin V- PI-), early apoptotic cells (Annexin V+ PI-), late apoptotic cells (Annexin V+ PI+) and necrotic cells (Annexin V- PI+), (n=8); (E) Percentages of Annexin V/PI FACS analysis of H520 cells: living cells (Annexin V- PI-), early apoptotic cells (Annexin V+ PI-), late apoptotic cells (Annexin V+ PI+) and necrotic cells (Annexin V- PI+), (n=6); (F) Annexin V/PI FACS analysis of patient BALF derived epithelial cells, apoptotic cells (Annexin V+) and induction of apoptosis based on each patient with 0mM SB for control and tumor, (n=2); (G) Annexin V/PI FACS analysis of patient tissue derived epithelial cells, apoptotic cells (Annexin V+) and induction of apoptosis based on each patient with 0mM SB for control and tumor, (ncontrol=3, nperitumoral=4, ntumor=1); (*P < 0.05; **P < 0.01; ***P < 0.001; ****P < 0.0001). Two-way_ANOVA test was used for figure (A, D, E), one-way ANOVA test was used for figure (F, G right panel) Kruskal-Wallis test was used for figure (G left panel). All data are presented as mean values ± SEM.

