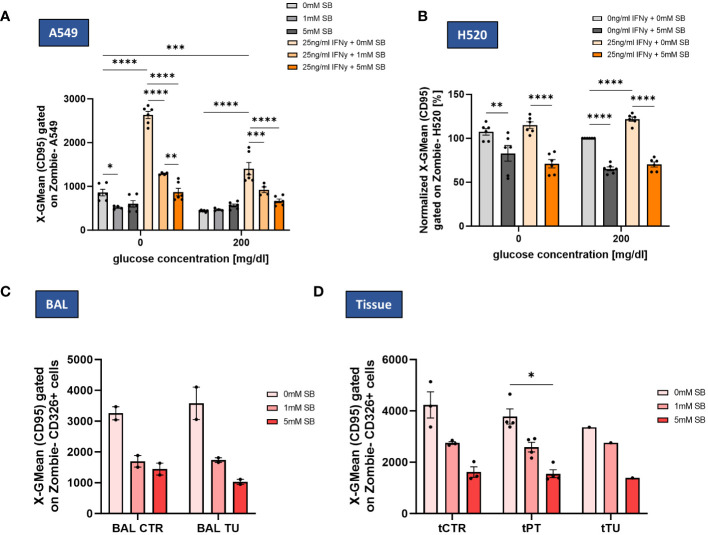
Figure 5.
SB decreased IFN-γ induced CD95 cell surface expression in lung cancer cell lines and NSCLC patient-derived cells. (A) SB reversed IFN-γ induced CD95 upregulation, geometric mean of CD95 expression on A549 cell surface after 72h analyzed by flow cytometry, (n=6); (B) Geometric mean of CD95 expression on H520 cell surface after 72h of cell culture normalized to the control population (200mg/dl glucose, 0mM SB, 0ng/ml IFN-γ), (n=6); (C) Geometric mean of CD95 surface expressing cells gated on CD326+ Zombie- BALF epithelial cells in control and tumor regions analyzed by flow cytometry (ncontrol=2; ntumor=2); (D) Geometric mean of CD95 surface expressing cells gated on CD326+ Zombie- tissue derived epithelial cells in control, peritumoral and tumor regions analyzed by flow cytometry, (ncontrol=3, nperitumoral=4, ntumor=1); (*P < 0.05; **P < 0.01; ***P < 0.001, ****P<0.0001). One-way ANOVA test was used for figure (A, B), Kruskal-Wallis test was used for figure (C, D) All data are presented as mean values ± SEM.

