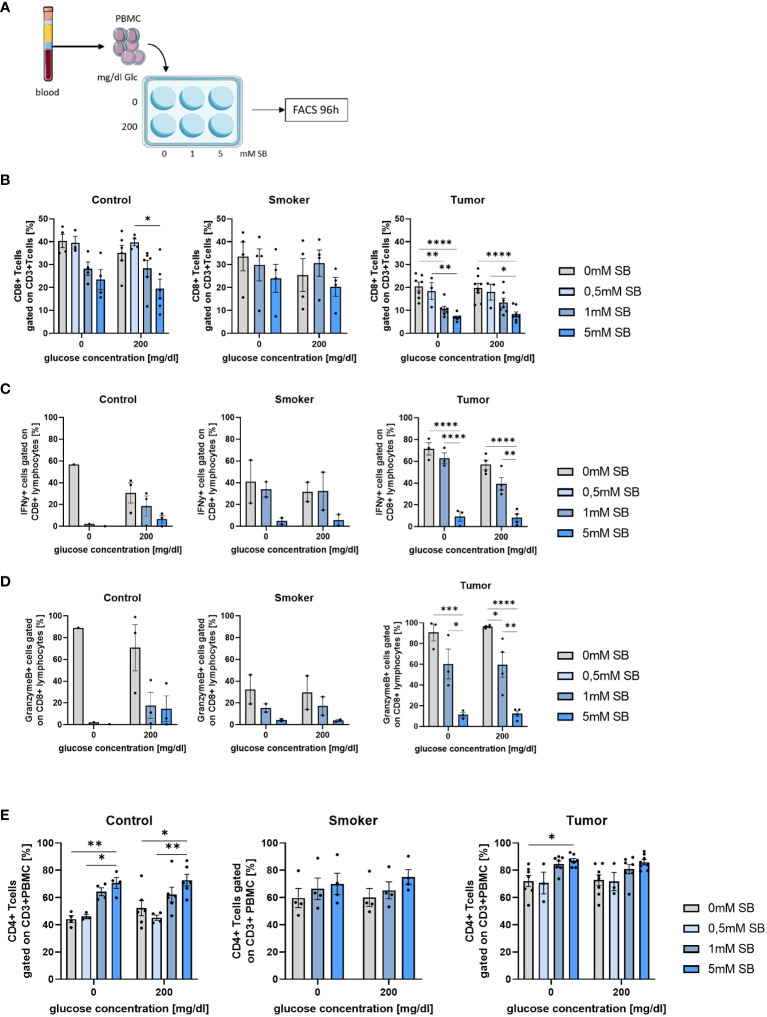
Figure 6.
CD8+ T cells and their IFN-γ and Granzyme production decreased after 96h SB treatment in vitro with different glucose levels; Percentages of CD4+ T cells increased upon SB treatment in all populations (A) Schematic illustration of the experimental design. 5x10⁵ PBMC from human patients per well with 500µl medium were incubated for 96h with 200mg/dl glucose or without and SB concentrations increased from 0mM, 0.5mM over 1mM to 5mM SB; (B) Percentages of CD8+ T cells gated on CD3+ Zombie- lymphocytes in control, smoker and tumor patients, (ncontrol=6; nsmoker=4; ntumor=8); (C) Percentage of IFN-γ production in CD8+ T cells after treatment with 0, 1, 5mM SB and aCD3/28 stimulation for 96h analyzed by flow cytometry, (ncontrol=3; nsmoker=2; ntumor=4); (D) Percentages of granzymeB production in CD8+ T cells treated with 0,1, 5mM SB and aCD3/28 stimulation for 96h; analyzed by flow cytometry, (ncontrol=3; nsmoker=2; ntumor=4); (E) Percentages of CD4+ CD3+ T cells gated on lymphocytes, cultured for 96h as described in Figure 4A , analyzed by flow cytometry, (ncontrol=6; nsmoker=4; ntumor=8); (*P < 0.05; **P < 0.01; ***P < 0.001; ****P < 0.0001). One-way ANOVA test was used for figure (B middle and left panel, C–E) Kruskal-Wallis test was used for figure (B left panel). All data are presented as mean values ± SEM. Parts of the figure were drawn by using pictures from Servier Medical Art and is licensed under a Creative Commons Attribution 3.0 Unported License (https://creativecommons.org/licenses/by/3.0/).”.

