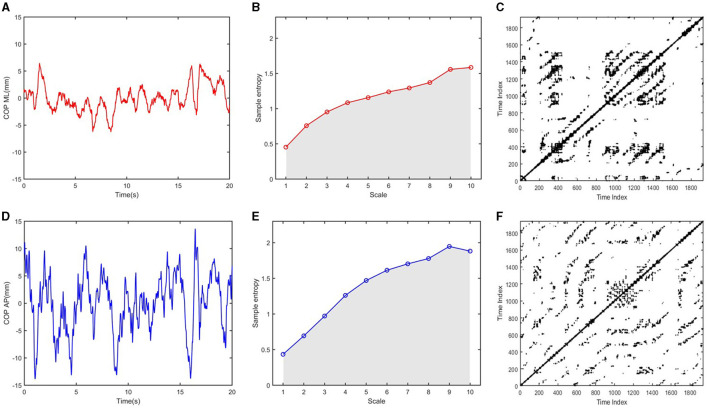
Figure 1.
Multiscale entropy and recurrence plots generated from COP signals: (A, D) COP time series in the ML and AP directions; (B, E) Multiscale entropy for 10 time scales were calculated from COP ML and COP AP time series, respectively; The complexity index (CI) was obtained by calculating the area under the sample entropy vs. the time scale; (C, F) Recurrence plots were generated from COP ML and COP AP time-series, respectively.

