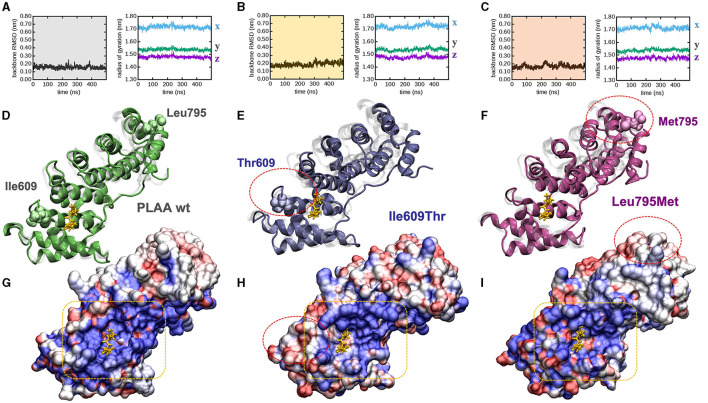
Figure 2.
PLAA molecular modeling and dynamic simulations. (A–C) Molecular dynamics trajectories analysis: backbone root mean squared deviation (left) and x, y, x, components of the backbone radius of gyration (right) for (A) wt, (B) Ile609Thr, and (C) Leu795Met. (D, E) End-simulation configuration for (D) wt, (E) Ile609Thr, and (F) Leu795Met, the configurations are superposed to the crystallographic structure 3EBB, chain A, where PLAA (shaded in gray) is bound to a the p97 fragment (highlighted in yellow). (G–I) Solvent accessible surface area of (G) wt, (H) Ile609Thr, and (I) Leu795Met, also in this case the configurations are superposed to the crystallographic structure 3EBB and the p97 fragment is highlighted (yellow), the surfaces are colored according to the calculated electrostatic potential at each surface point: positive (blue), negative (red), and neutral/hydrophobic (white). For ease of comparison among panels red circles highlight the mutations in (E–I), and a yellow box highlights the PLAA positively charged groove (G–I). All configurations are snapshots taken at 500 ns. Water molecules have been omitted for ease of interpretation.

