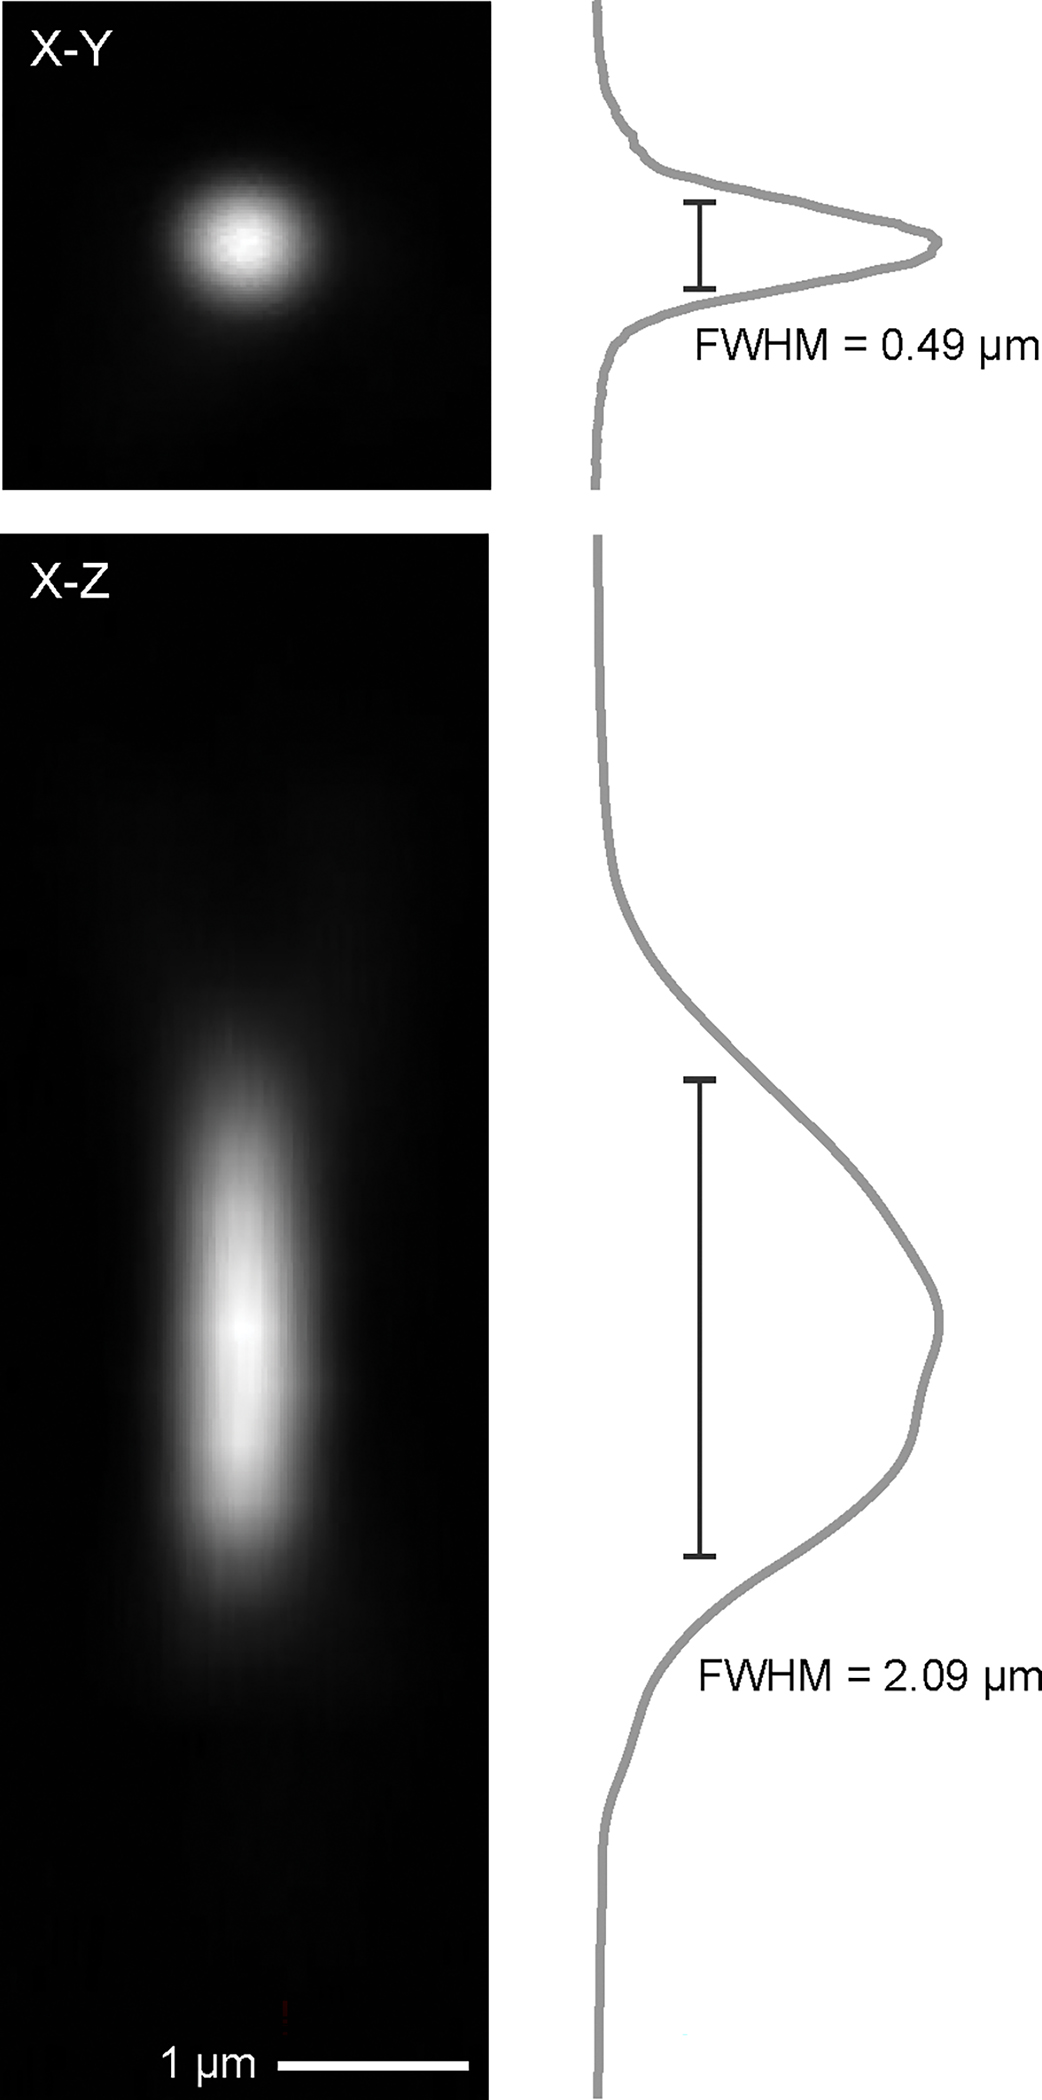
Figure 14 |. Point spread function after system aberration correction.

Point spread function measured from a 200-nm diameter fluorescent bead after the correcting the system aberration. Scale bar, 1 μm. Upper row, image of the X-Y plane with the signal profile showing the lateral resolution. Bottom row, image of the X-Z plane with the signal profile, showing the axial resolution.
