
Figure 18 |. Functional imaging AO correction.
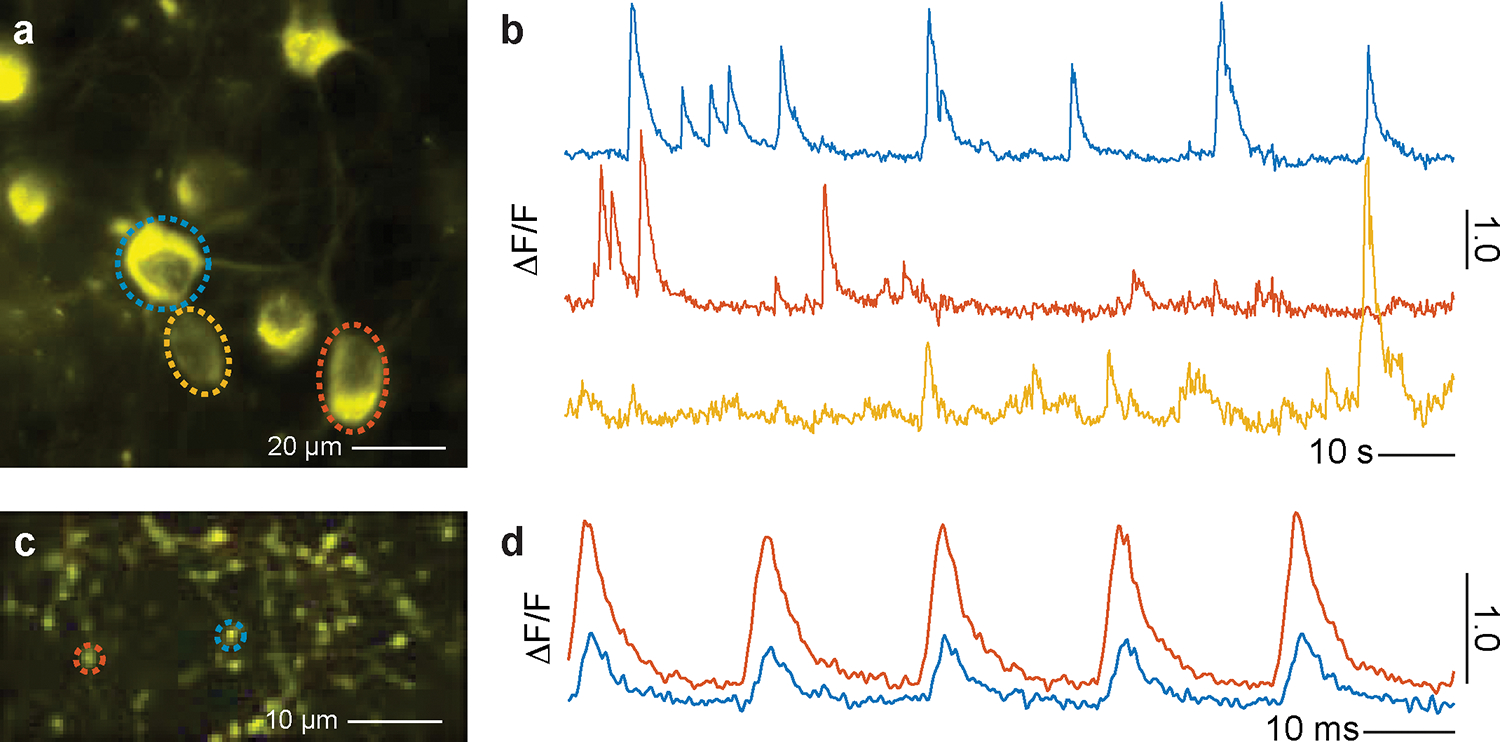
a, In vivo two-photon imaging of the layer 5 neurons of vS1 cortex which were labelled with jRGECO1a. Data were obtained at 630 μm below the pia with full AO correction using excitation wavelength λ = 1030 nm. b, Calcium signal in the ROIs defined by the dashed circles in panel a. c, In vivo two-photon imaging of the thalamocortical boutons which were labelled with iGluSnFR3. Data were obtained at layer 4 of vS1 cortex with full AO correction using excitation wavelength λ = 970 nm. d, Glutamate dynamics responding to 5 Hz air puff in the ROIs defined by the dashed circles in panel c. The trace is averaged from 60-s recording.