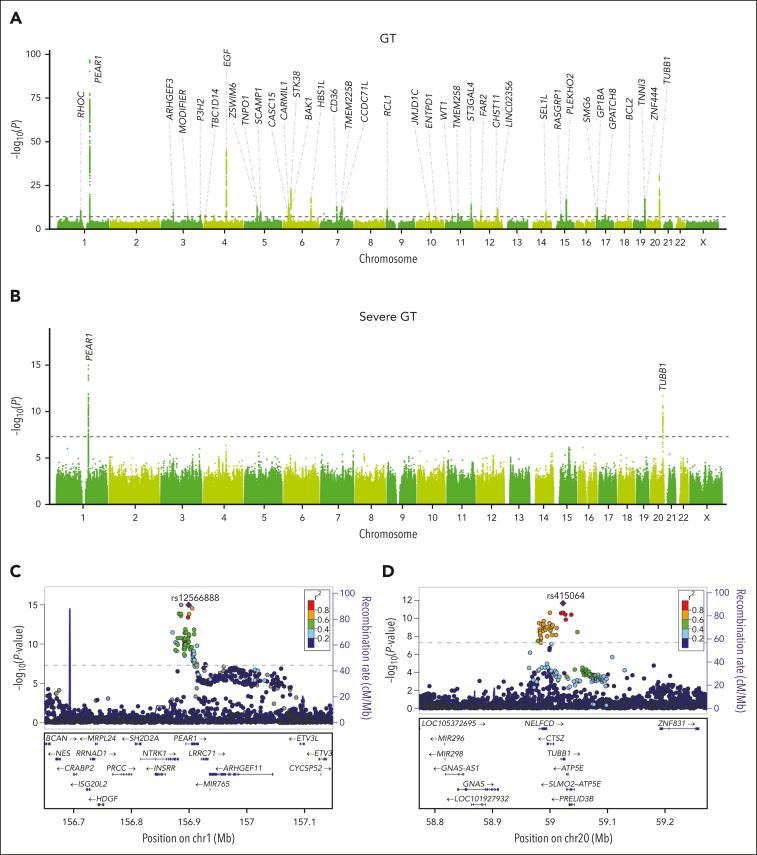
Figure 5.
Manhattan plots and regional association plots for GWAS meta-analyses of GT and severe GT. Manhattan plots for GWAS meta-analysis of GT (11 138 cases and 85 294 controls) (A) and severe GT (906 cases and 97 283 controls) (B). GWAS for each hospital was carried out with a logistic regression model and the first to 10th principal components and maternal age as covariates. The x-axis shows the ordered chromosomes, and the y-axis indicates –log10 (P value) for the association tests. The dashed black line represents the genome-wide significance threshold of the P value for GWAS (P = 5 × 10⁻⁸). Labels in black indicate the nearest gene of the novel loci. Regional association plots for GWAS meta-analysis of severe GT at 1q23.1 (PEAR1) (C) and 20q13.32 (TUBB1) (D). The x-axis shows the chromosomal positions (GRCh38) and the y-axis indicates –log10(P value) for the association tests. The purple diamond indicates the lead SNP of each locus. The other SNPs are colored based on their LD r2 with the lead SNP. The horizontal dashed gray line represents the genome-wide significance threshold for GWAS (P = 5 × 10⁻⁸).

