Figure.
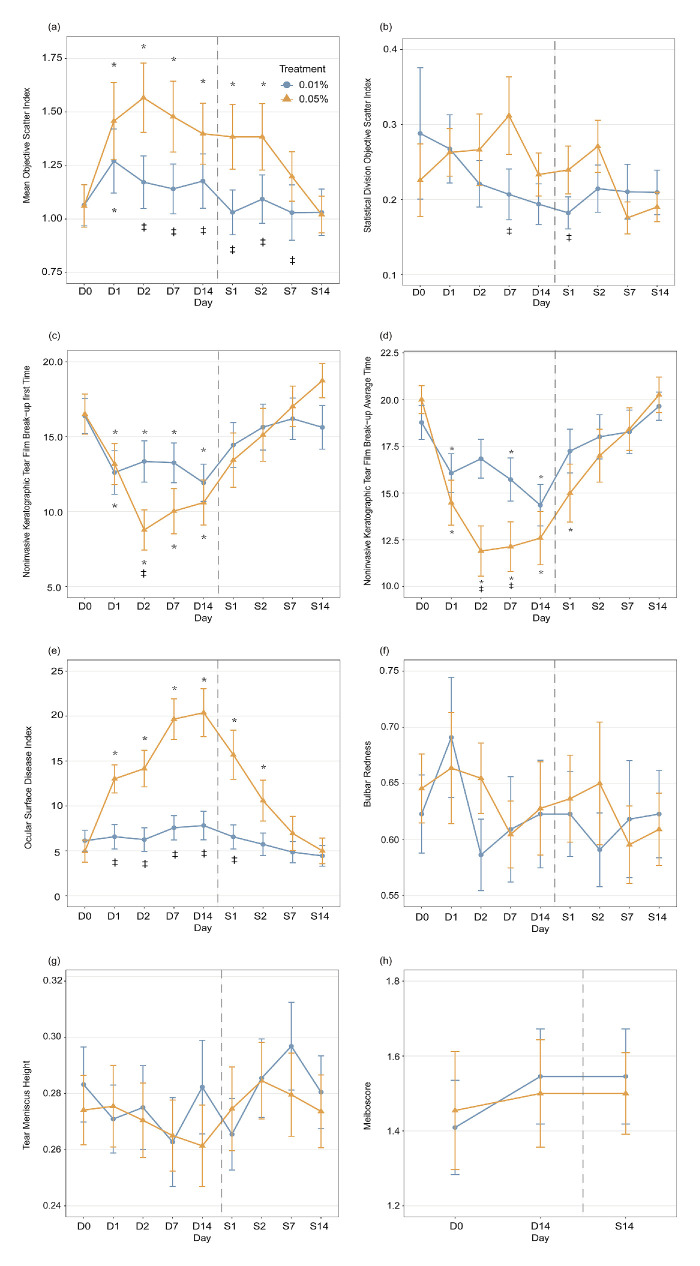
Changes in ocular surface parameters across time with 0.05% (orange) and 0.01% (blue) atropine use and cessation. (a) Mean OSI, (b) standard deviation OSI, (c) NIKBUT-first , (d) NIKBUT-average, (e) OSDI, (f) bulb redness, (g) TMH, and (h) meiboscore. D0 indicates the baseline measurement, whereas D1/D2/D7/D14 represent one/two/seven and 14 days of applying atropine, and S1/S2/S7/S14 indicate one/two/seven and 14 days after stopping the use of atropine. The gray line is the boundary between applying atropine and stopping its use. Error bars: standard errors of the mean. *P < 0.05, for data compared with baseline; ‡P < 0.05 for data compared between the two concentrations of atropine.

