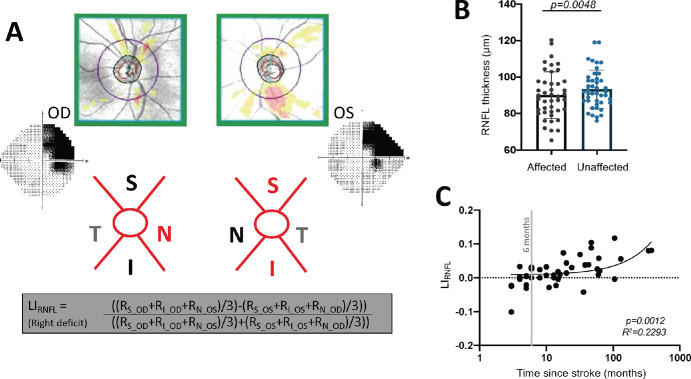
Figure 2.
(A) Computation of LI using RNFL thickness values (R) from superior (S) and inferior (I) peripapillary regions comprising uncrossed fibers and nasal (N) peripapillary regions comprising crossed fibers representing intact or blind hemifields. (B) Plot comparing affected peripapillary RNFL segments carrying RGC axons representing the visual field defect to unaffected ones carrying predominantly intact field fibers (paired t-test, 95% CI = 1.046 to 5.450, t42 = 2.977, P = 0.0048). (C) Plot of LIRNFL against time since stroke (linear regression, R2 = 0.2293, 95% CI = −0.0004 to 0.0217, P = 0.0012).

