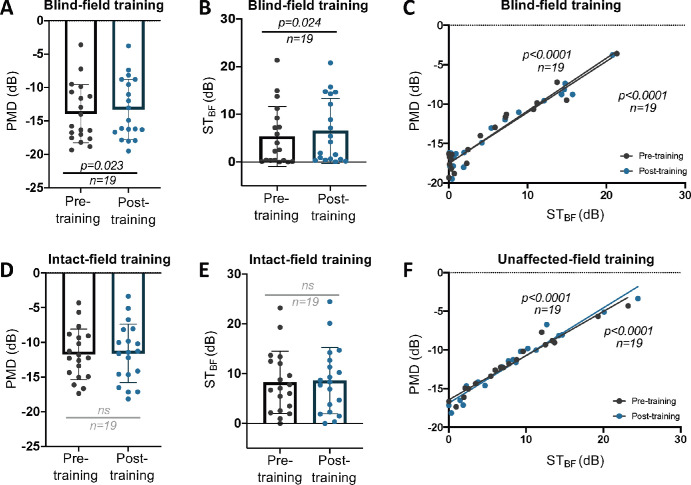
Figure 3.
(A) Plot of pre- and posttraining OU MD in BF-trained participants (paired t-test, 95% CI = 0.098 to 1.2, t18 = 2.473, P = 0.023, mean of differences = 0.65 ± 1.15). (B) OU STBF pre- and posttraining following BF training (paired t-test, 95% CI = 0.177 to 2.258, t18 = 2.458, P = 0.024, mean of differences = 1.22 ± 2.16). (C) Linear regression of MD against STBF pretraining: R2 = 0.9365, 95% CI (y-intercept) = −18.28 to −16.82; post-BF training: P < 0.0001; R2 = 0.9526, 95% CI (y-intercept) = −18.21 to −16.84, P < 0.0001. (D) Plot of pre- and posttraining OU MD in IF-trained participants (paired t-test, 95% CI = −0.3284 to 0.6284, t18 = 0.6587, P = 0.5184, mean of differences = 1.5 ± 0.9926). (E) OU STBF pre- and posttraining following IF training (paired t-test, 95% CI = −0.1917 to 0.8655, t18 = 1.339, P = 0.1972, mean of differences = 0.3369 ± 1.097). (F) Linear regression of MD against STBF pretraining: R2 = 0.963, 95% CI (y-intercept) = −17.04 to −15.87; post-IF training: P < 0.0001; R2 = 0.9481, 95% CI (y-intercept) = −17.67 to −16.08, P < 0.0001). ns, not statistically significant.

