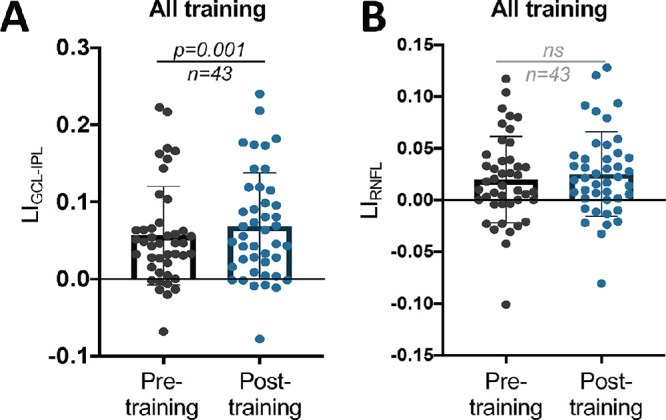
Figure 4.

(A) Plot of LIGCL-IPL pre- and posttraining for all participants (paired t-test, 95% CI = 0.005 to 0.019, t42 = 3.424, P = 0.001). (B) Plot of LIRNFL pre- and posttraining for all participants (paired t-test, 95% CI = −0.0015 to 0.01251, t42 = 1.572, P = 0.1234). ns, not statistically significant.
