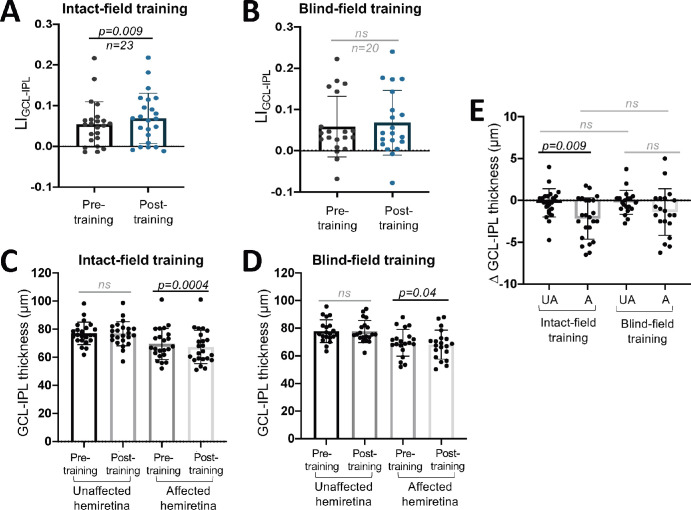
Figure 5.
(A) Plot of LIGCL-IPL pre- and posttraining for participants who trained in their IF (paired t-test, 95% CI = 0.003 to 0.025, t22 = 2.837, P = 0.0096). (B) Plot of LIGCL-IPL pre- and posttraining for participants who trained in their BF (paired t-test, 95% CI = −0.0008 to 0.0199, t19 = 1.916, P = 0.07). (C) Comparisons of unaffected and affected hemiretina GCL-IPL thicknesses, before and after training in the IF (unaffected pre- versus posttraining: paired t-test, 95% CI = −1.017 to 0.4516, P = 0.4332; affected pre- versus posttraining: paired t-test, 95% CI = −3.233 to −1.093, P = 0.0004). (D) Comparison of unaffected and affected hemiretina GCL-IPL thicknesses, before and after BF training (unaffected pre- versus posttraining: paired t-test, 95% CI = −0.8943 to 0.4443, P = 0.4902; affected pre- versus posttraining: paired t-test, 95% CI = −2.691 to −0.0843, P = 0.04). (E) Comparison of change in GCL-IPL thickness from pre- to posttraining in IF- or BF-trained participants (unaffected versus affected hemiretina in IF-trained subjects, paired t-test, 95% CI = 0.2063 to 3.555, P = 0.009; unaffected versus affected hemiretina in BF-trained subjects, 95% CI = −2.601 to 0.2762, P = 0.1071; unaffected versus unaffected of both training groups, unpaired t-test, 95% CI = −0.9176 to 1.033, P = 0.9056; affected versus affected of both training groups, unpaired t-test, 95% CI = −0.8438 to 2.395, P = 0.3391). A, affected; ns, not statistically significant; UA, unaffected.

