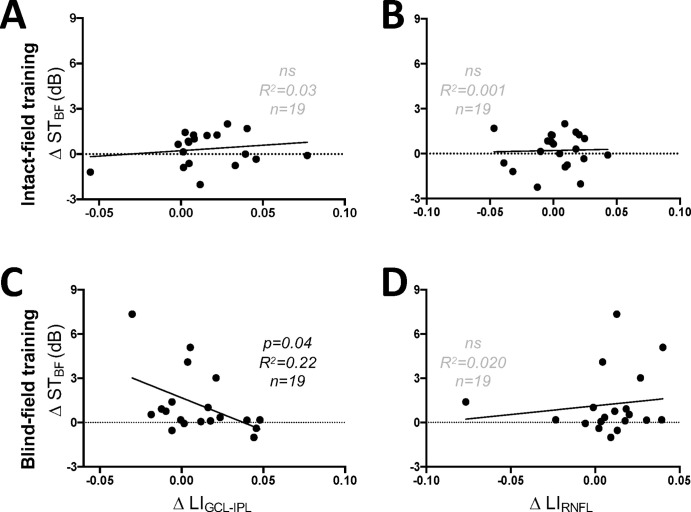
Figure 7.
(A) Plot of change in STBF against LIGCL-IPL of participants trained in their IF (linear regression, R2 = 0.0307, 95% CI (y-intercept) = −0.3997 to 0.8511, P = 0.4727). (B) Plot of changes in STBF and LIRNFL in IF-trained participants (linear regression, R2 = 0.001, 95% CI (y-intercept) = −0.3497 to 0.766, P = 0.8857). (C) Plot of change in STBF against LIGCL-IPL of participants trained in their BF (linear regression, R2 = 0.2170, 95% CI (y-intercept) = 0.6239 to 2.723, P = 0.04). (D) Plot of changes in STBF and LIRNFL in participants training in the BF (linear regression, R2 = 0.0196, 95% CI (y-intercept) = 0.0093 to 2.241, P = 0.5674).

