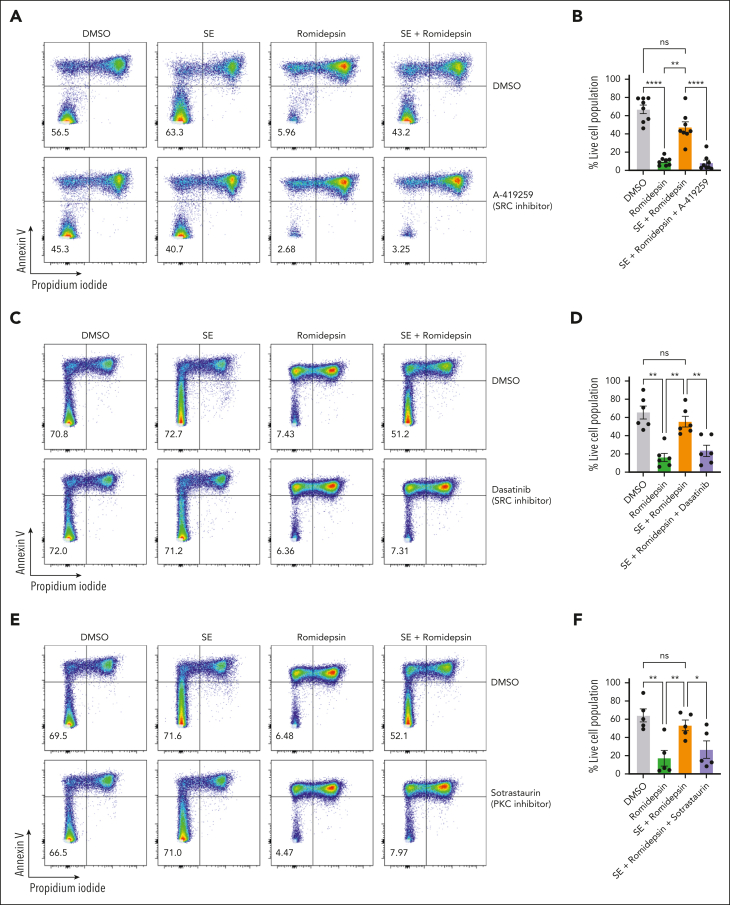
Figure 4.
SE-induced drug resistance is mediated by TCR signaling via LCK-PKC-NF-κB. Representative flow cytometric plots (SS4 [A]; SS13 [C,E]) and quantifications of percentage of viable malignant cells from PBMCs of patients with SS treated with 2 nM romidepsin for 72 hours in the presence or absence of SE and 2 μM A-419259 (A-B) (Src inhibitor) (n = 8 [SS4, SS5, SS8, SS10, SS12, SS13, SS14, and SS15]), 100 nM dasatinib (C-D) (n = 6 [SS4, SS8, SS10, SS12, SS13, and SS15]), and 1.5 μM sotrastaurin (E-F) (PKC inhibitor) (n = 5 [SS4, SS10, SS12, SS13, and SS15]). Statistical significance was assessed by repeated measures 1-way ANOVA followed by Tukey multiple comparison test. ∗P < .05; ∗∗P < .01; ∗∗∗∗P < .0001. DMSO, dimethyl sulfoxide.

