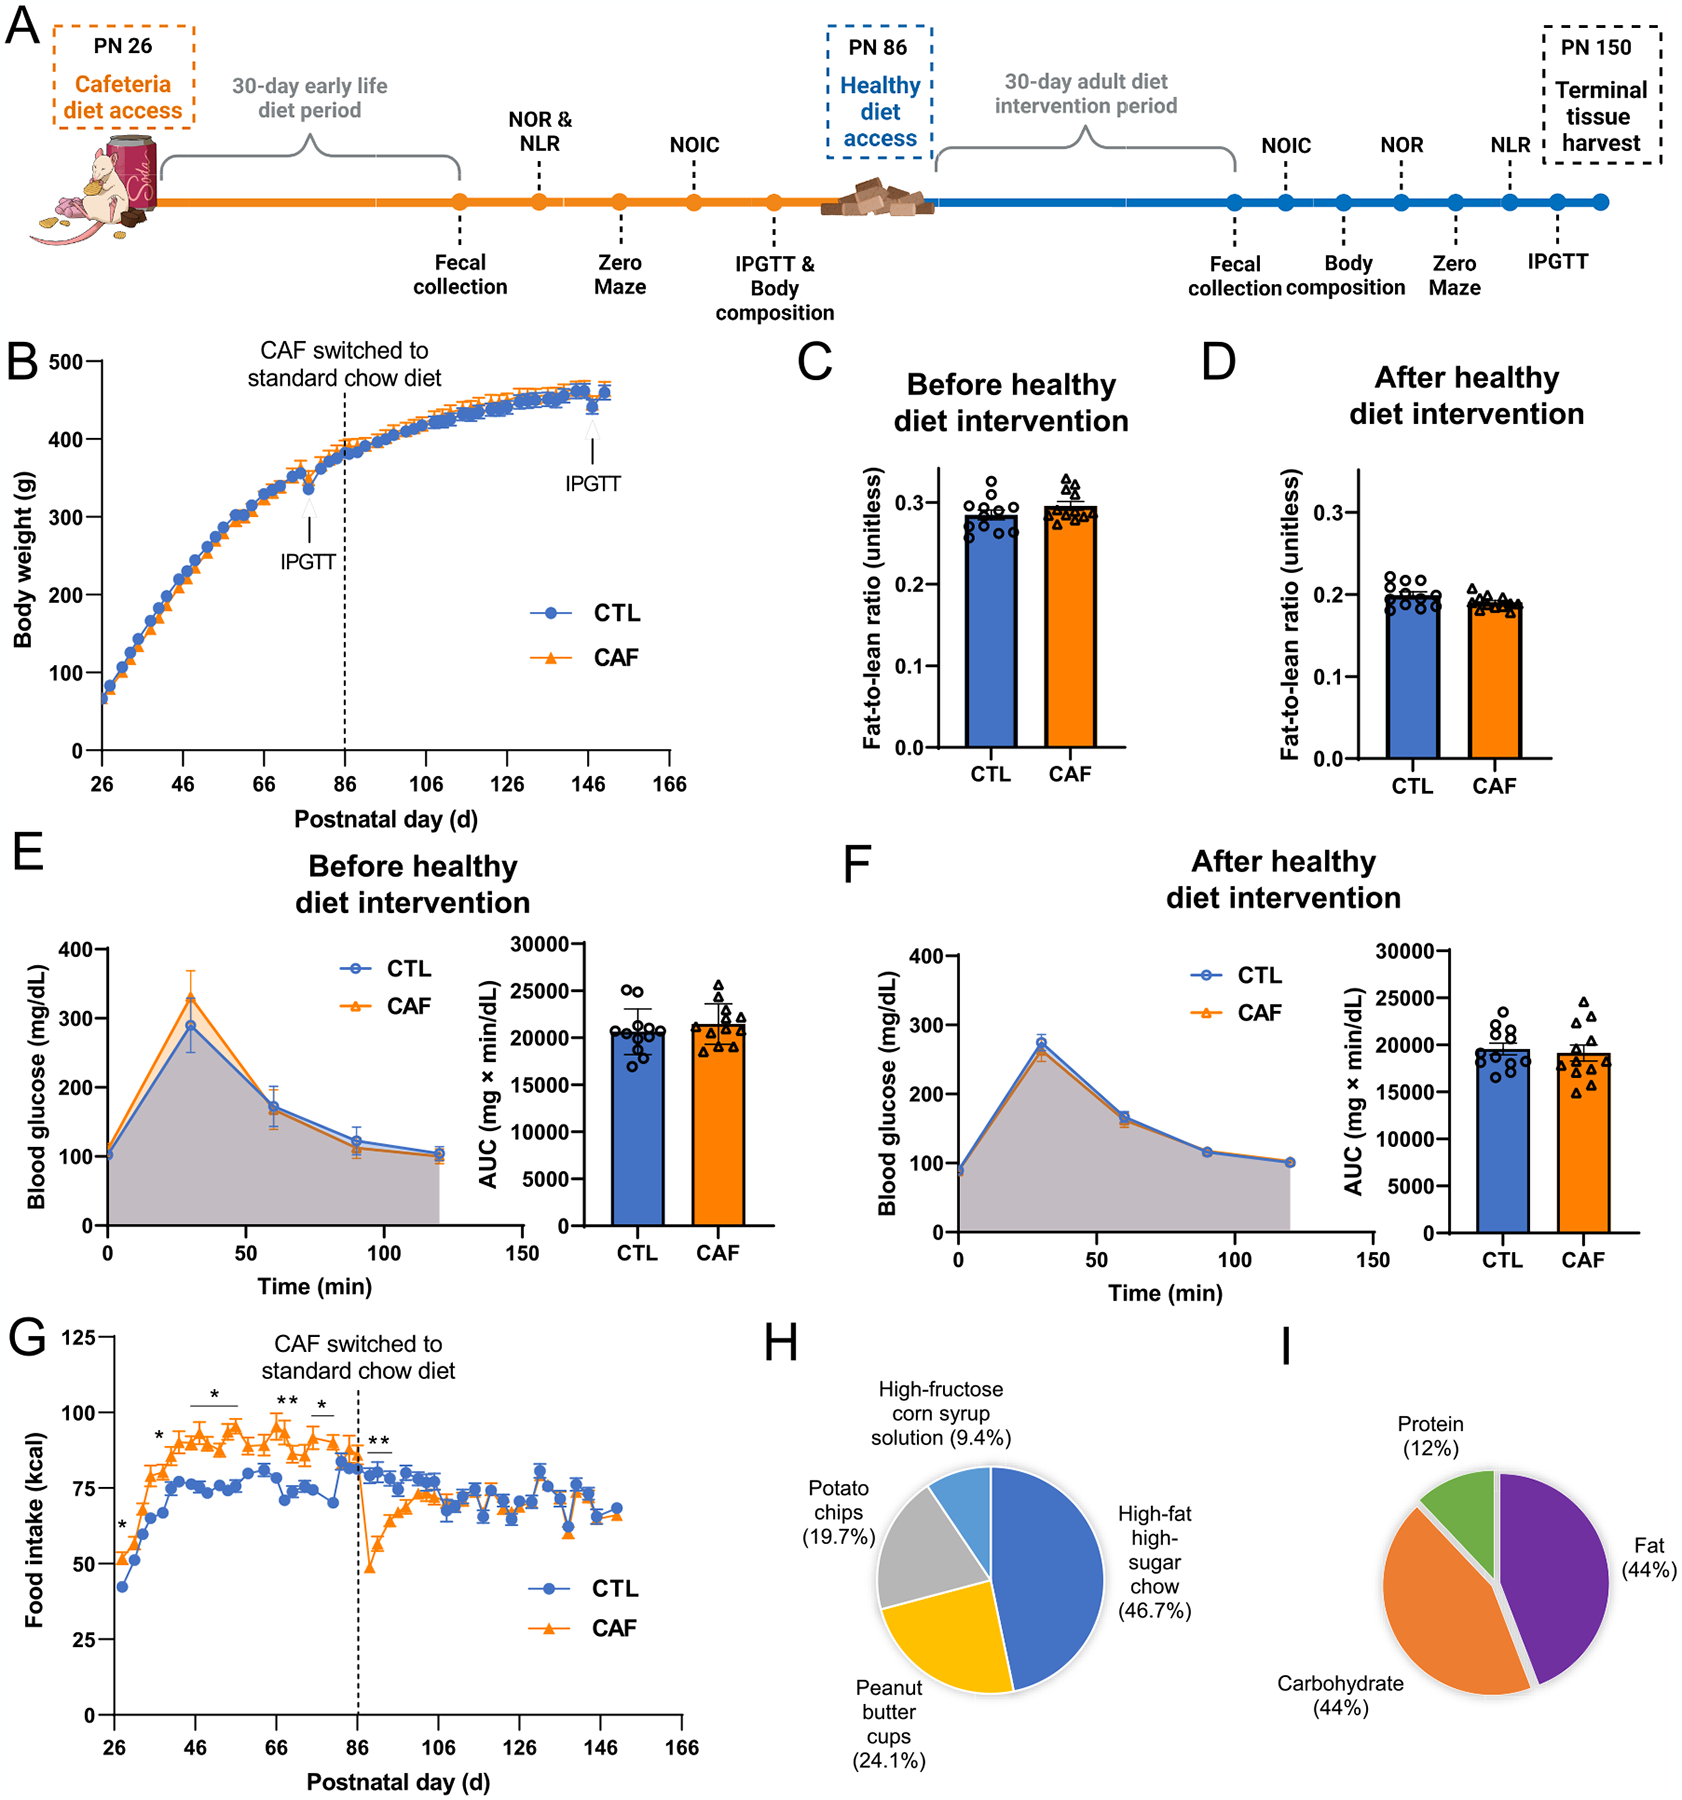
Fig. 1.

Early life Western diet consumption does not result in immediate or persistent alterations in body weight trajectory, body composition, or glucose tolerance, despite promoting hyperphagia during the Western diet (WD) period. (A) Experimental design timeline for behavioral and metabolic assessments. (B) Body weight over time (postnatal day) throughout the course of study for the main metabolic and behavioral cohort (N = 24 total rats, n = 12 CTL, n = 12 CAF; two-way ANOVA with repeated measures over time; time × diet: P = 0.0004, no post hoc differences using Sidak’s multiple comparisons test, time: P < 0.0001, diet: P = 0.8772; additional cohorts are shown in Fig. S1). (C) Assessment of body composition (fat-to-lean ratio) following the WD period but before the healthy diet intervention (N = 24 total rats, n = 12 CTL, n = 12 CAF; unpaired t-test [2-tailed]; P = 0.0766; additional body composition values can be found in Fig. S2). (D) Assessment of body composition (fat-to-lean ratio) following the healthy diet intervention (N = 24 total rats, n = 12 CTL, n = 12 CAF; unpaired t-test [2-tailed]; P = 0.1834; additional body composition values can be found in Fig. S2). (E) Glucose tolerance test results after the WD period but before the healthy diet intervention (N = 24 total rats, n = 12 CTL, n = 12 CAF; two-way ANOVA (diet, time [as repeated measure], diet × time interaction) for blood glucose over time; unpaired t-test [2-tailed] for blood glucose AUC; time × diet: P < 0.0001, no post hoc differences using Sidak’s multiple comparisons test, time: P < 0.0001, diet: P = 0.3812, for AUC: P = 0.3861). (F) Glucose tolerance test results following the healthy diet intervention (N = 24 total rats, n = 12 CTL, n = 12 CAF; two-way ANOVA (diet, time [as repeated measure], diet × time interaction) for blood glucose over time; unpaired t-test [2-tailed] for blood glucose AUC; time × diet: P = 0.8630, time: P < 0.0001, diet: P = 0.7111, for AUC: P = 0.6909). (G) Food intake expressed as kcal over time (postnatal day) throughout the course of study for the main metabolic and behavioral cohort (N = 24 total rats, n = 12 CTL, n = 12 CAF; two-way ANOVA with repeated measures over time; time × diet: P < 0.0001, many post hoc differences using Sidak’s multiple comparisons test, time: P < 0.0001, diet: P = 0.0479; additional cohorts are shown in Fig. S1). (H) Percentage of energy intake consumed from the CAF diet components for the main metabolic and behavioral cohort (N = 24 total rats, n = 12 CTL, n = 12 CAF; additional cohorts are shown in Fig. S1). (I) Percentage of energy intake from macronutrients for the main metabolic and behavioral cohort (N = 24 total rats, n = 12 CTL, n = 12 CAF; additional cohorts are shown in Fig. S2). AUC, area under the curve; CAF, cafeteria diet group; CTL, control group; WD, Western diet. Error bars represent ± SEM. *P < 0.05, **P < 0.01.
