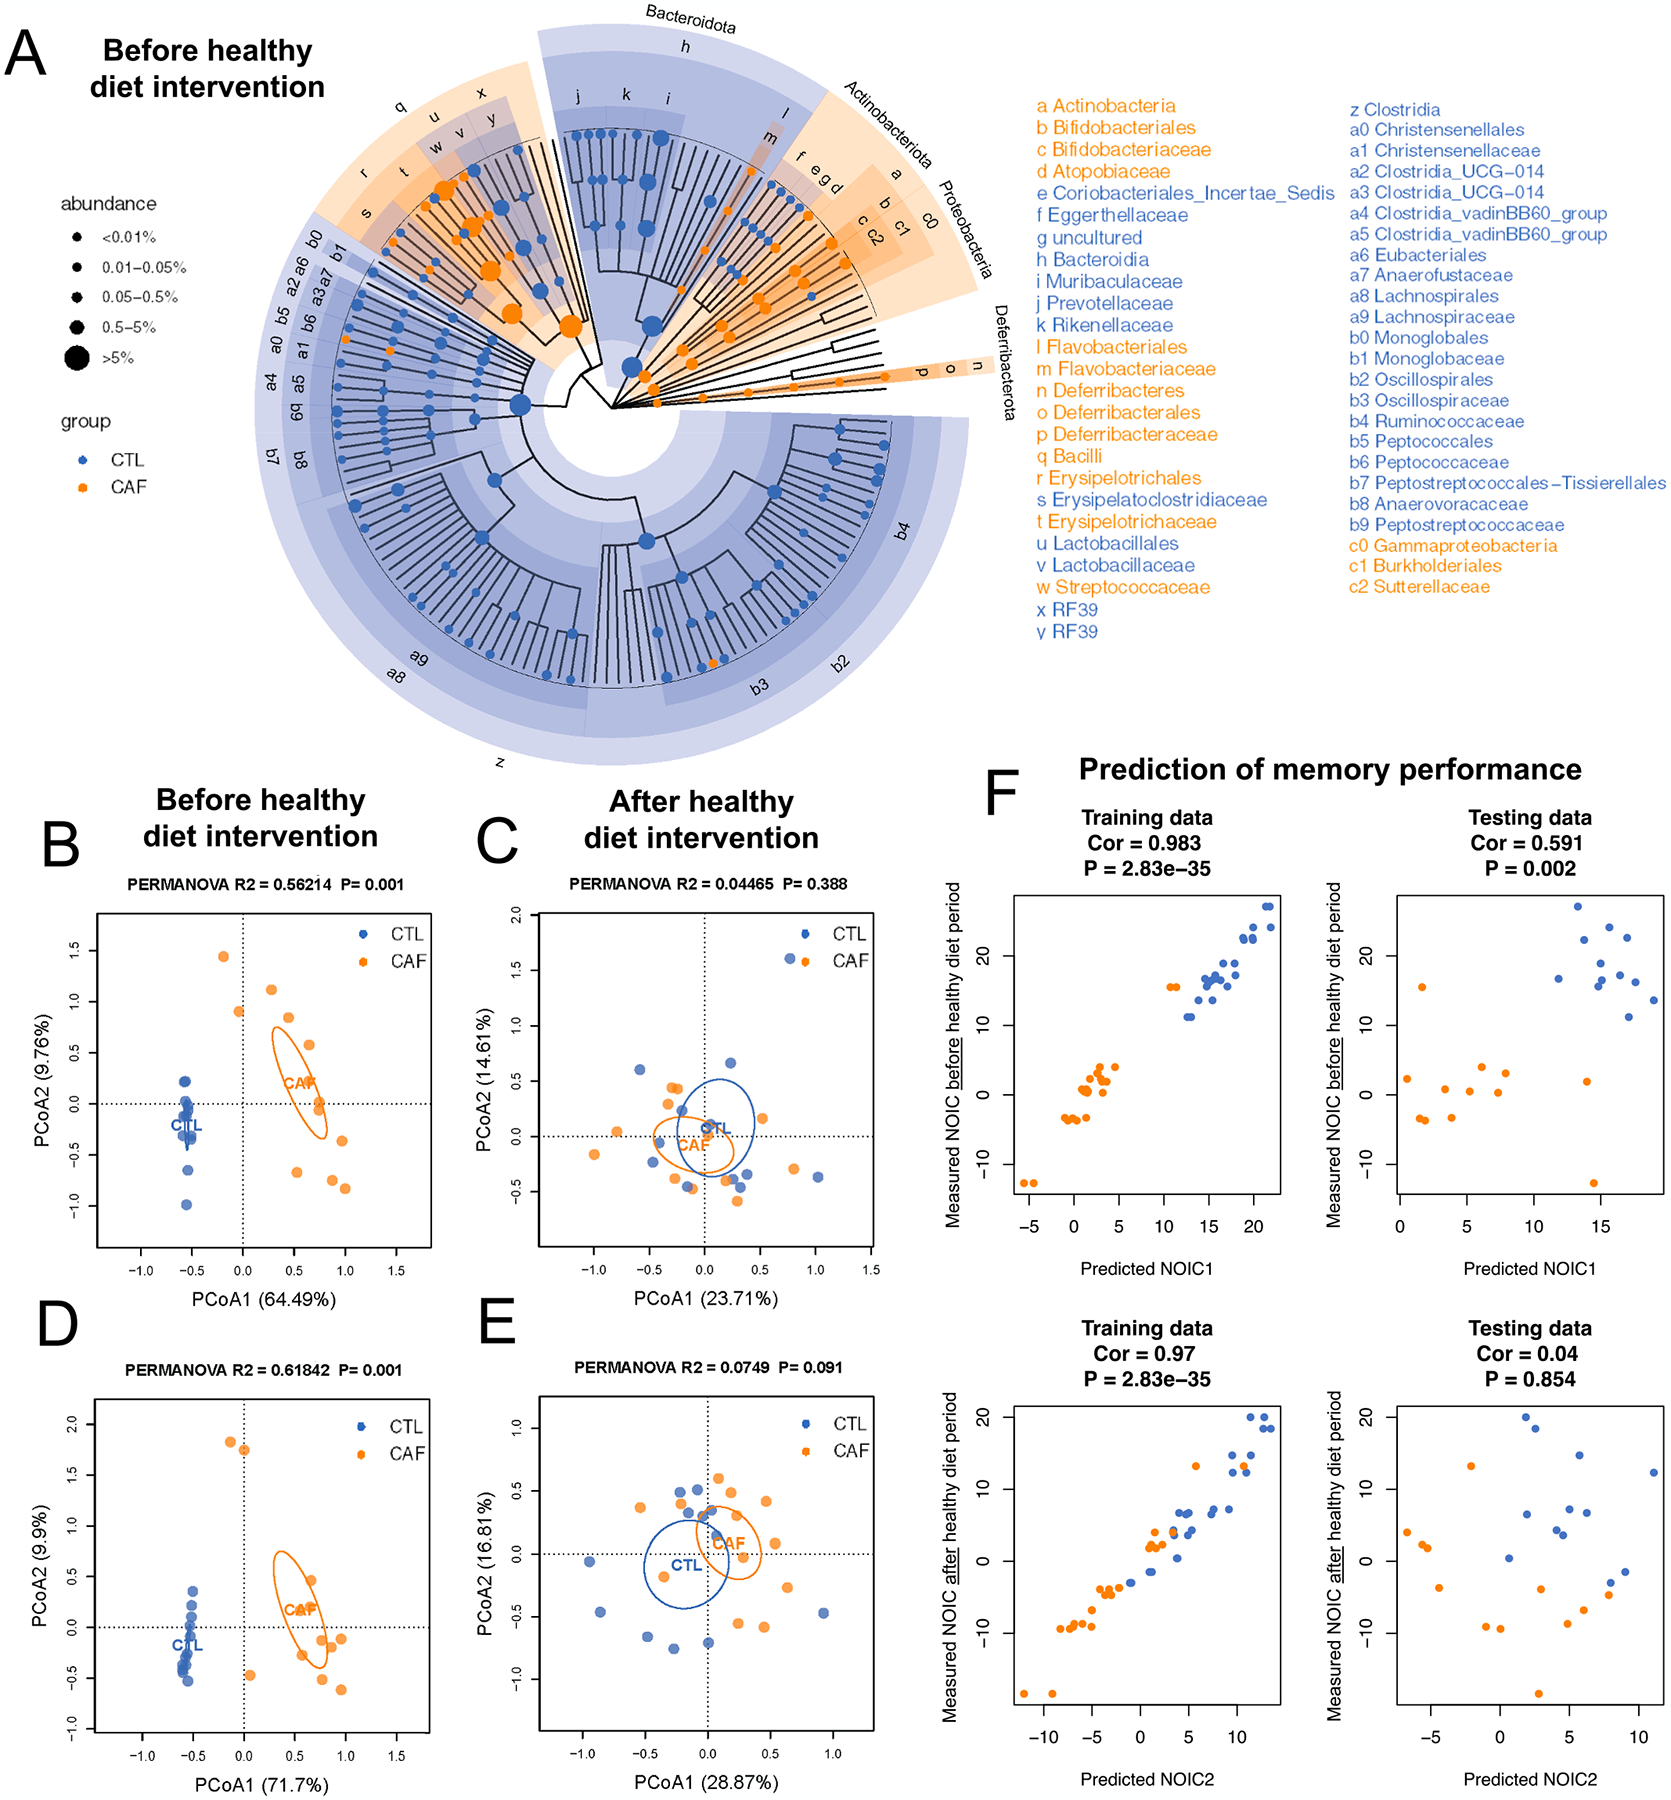
Fig. 3.

Early life Western diet (WD) robustly alters the gut microbiome, but these alterations do not persist upon a healthy diet intervention in adulthood. (A) Cladogram representation of differentially abundant taxa in fecal matter after the WD period but before the healthy diet intervention period (N = 24 total, n = 12 CTL, n = 12 CAF; false discovery rate [FDR] < 0.1 for significant taxa). (B) Principal coordinate analysis (PCoA) of microbiomes at the genus level in fecal matter after the WD access period (N = 24 total, n = 12 CTL, n = 12 CAF; Bray-Curtis dissimilarity; PERMANOVA, R2 = 0.56214, P = 0.001, P < 0.05 for significant associations). (C) PCoA of microbiomes at the genus level in fecal matter after the healthy diet intervention period (N = 24 total, n = 12 CTL, n = 12 CAF; Bray-Curtis dissimilarity; PERMANOVA, R2 = 0.04465, P = 0.388). (D) PCoA of microbiomes at the genus level in cecal content after the WD access period (N = 24 total, n = 12 CTL, n = 12 CAF; Bray-Curtis dissimilarity; PERMANOVA, R2 = 0.61842, P = 0.001). (E) PCoA of microbiomes at the genus level in cecal content after the healthy diet intervention period (N = 24 total, n = 12 CTL, n = 12 CAF; Bray-Curtis dissimilarity; PERMANOVA, R2 = 0.0749, P = 0.388). (F) Machine learning analysis to evaluate whether microbiome composition before the healthy diet intervention period reliably predicts NOIC memory performance either before or after the healthy diet period (N = 24 total, n = 12 CTL, n = 12 CAF; random forest regression models, 3-fold cross validation; for training data: Cor 0.983 and P = 2.83e-35 [before healthy diet intervention period], Cor 0.97 and P = 2.83e-35 [after healthy diet intervention period]; for testing data: Cor 0.591 and P = 0.002 [before healthy diet intervention period], Cor 0.04 and P = 0.854 [after healthy diet intervention period]). CAF, cafeteria diet group; CTL, control group; FDR, false discovery rate; PCoA, principal coordinate analysis; WD, Western diet.
