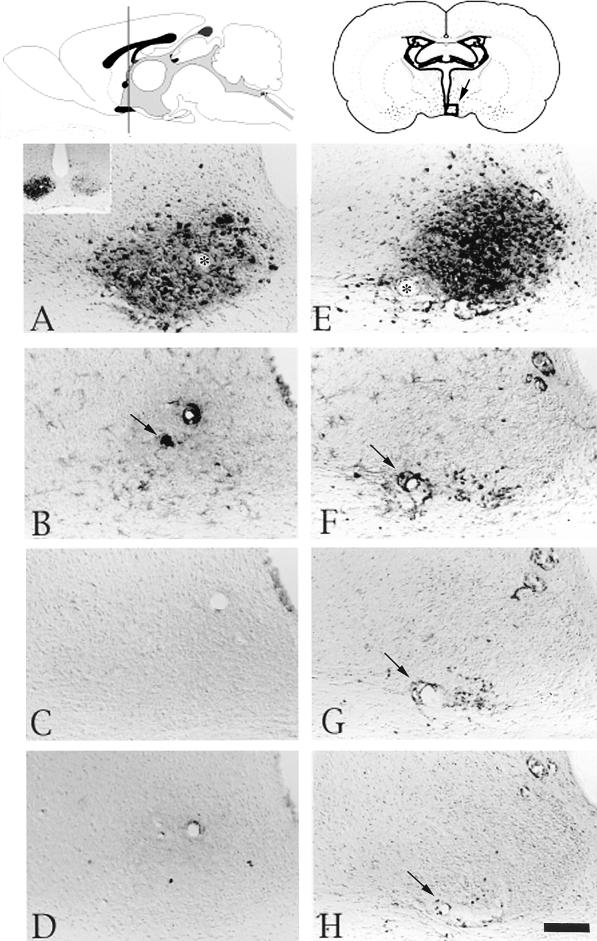
FIG. 5.
Localization of viral antigen and phenotypically distinct populations of leukocytes in the SCN after injection of PRV Becker into the vitreous body of the eye. At the top of the figure are schematic drawings of a sagittal view of the brain (left) and a coronal section with an open square indicating the location of the SCN (right). The micrographs are of adjacent sections of tissue from a representative animal with several infected neurons in the SCN (A to D) and from a representative animal with many more infected neurons in the SCN (E to H). They illustrate viral immunoreactivity (A and E), immunoreactivity of cells expressing the CD45 antigen (B and F), ED-1+ immunoreactive cells (C and G), immunoreactive CD8β+ leukocytes (D and H). Scale bar, 100 μm for all figures. Asterisks in panels A and B and arrows in panels B, F, G, and H indicate blood vessels.

