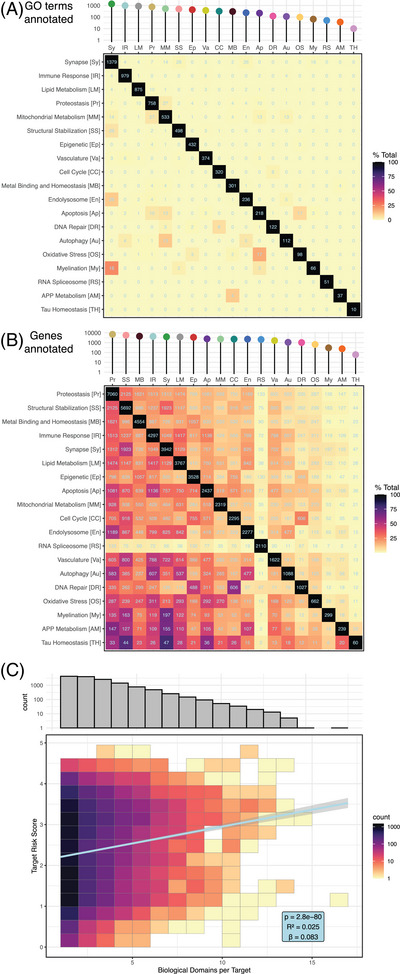
FIGURE 1.

Biological domain demographics. (A) Number of GO terms employed to define each biological domain, shown as an interaction plot, with total number of terms per domain along diagonal and number of terms shared between domains arranged in external rows and columns. (B) Number of genes in each biological domain, organized as in (A), with total genes within each domain along diagonal and pairwise genes shared between domains heat mapped within rows and columns. (C) The top histogram shows the frequency of a gene annotation across the 19 biological domains for genes annotated to at least one biological domain. The histogram shows a decline in the number of genes annotated to multiple biological domains, with genes mapping to a single biological domain being the most numerous (4258). The lower plot shows the positive correlation between gene annotation in multiple biological domains and its target risk score, with higher scoring genes participating in multiple biological domains.
