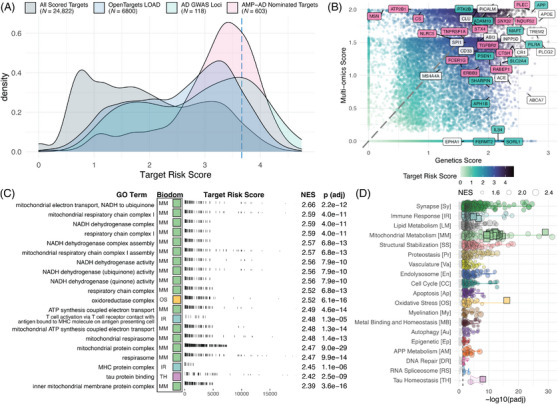
FIGURE 4.

Composite TREAT‐AD target risk score (TRS). (A) Distribution of TRS for all scored targets (gray), those scored by the Open Targets platform (blue), those nominated by a team from the AMP‐AD consortium (pink), and the set of defined AD GWAS loci derived from various sources (green). Dashed blue line indicates the 95th percentile score. (B) Comparison of genetics score and multi‐omic score for all targets. Point color indicates the composite TRS for the target. Labeled genes represent a subset of either GWAS genes (green), AMP‐AD nominated genes (pink), or both (white). (C) Top GO terms significantly enriched using the TRS, arranged by normalized enrichment score (NES). For each term, the resident biological domains are indicated by the filled square (biological domain colors can be referenced from panel D). (D) Enrichment statistics for all biological domain GO terms. Each point is a GO term within the indicated biological domain, and the size of the point is scaled by the GSEA NES. The terms identified in panel (C) are indicated as square points with bold borders. The biological domain terms are ordered on the y‐axis by the number of significantly enriched terms identified from each domain.
